The AUD/USD reversed directions last week, losing some 230 points. AUD/USD closed the week at 0.7814. There are only 5 events this week. Here is an outlook on the major market-movers and an updated technical analysis for AUD/USD.
US housing numbers were mixed and manufacturing numbers slipped, but the FOMC minutes were optimistic in tone, as policymakers remain confident that Q2 will outperform a disappointing Q2. The RBA minutes indicated that policymakers were open to further easing, which hurt the Australian dollar.
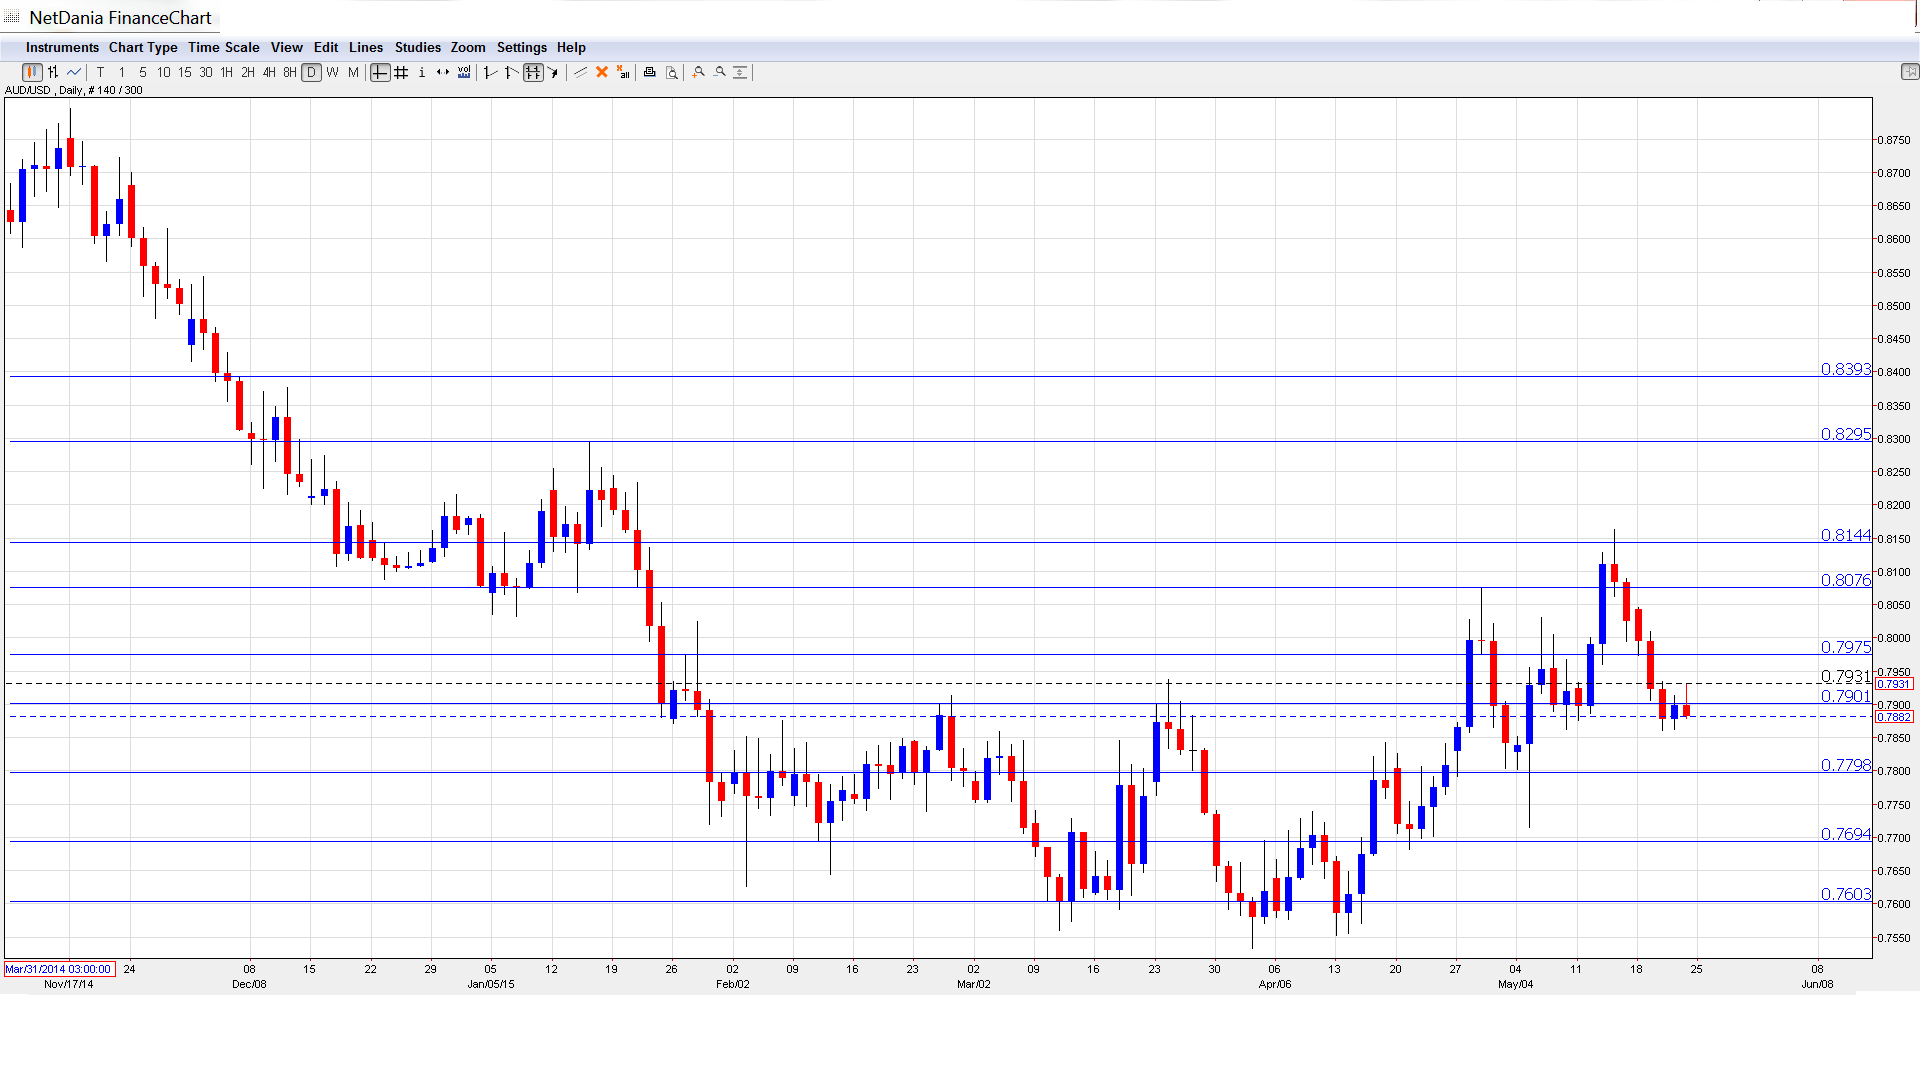
[do action=”autoupdate” tag=”AUD/USDUpdate”/]AUD/USD graph with support and resistance lines on it. Click to enlarge:
- MI Leading Index: Wednesday, 00:30. The index is based on 9 economic indicators, but is a minor event since most of the data has been previously released. The indicator posted a decline of -0.3% in March, marking an 11-month low.
- Construction Work: Wednesday, 1:30. This important indicator provides a snapshot of the level of activity in the construction sector. The indicator continues to struggle, with just one gain in the past 9 quarters. The Q4 reading came in at -0.2%, which was better than the estimate of -1.2%.
- Private Capital Expenditure: Thursday, 1:30. This is the key indicator of the week. It is released each quarter, magnifying the impact of each release. The indicator slipped badly in Q4, coming in at -2.2%. This was worse than the forecast of -1.7%. Will we see an improvement in the Q1 report?
- HIA New Home Sales: Friday, 1:00. Analysts closely monitor New Home Sales, as the purchase of a new home has a ripple effect on other sectors of the economy. The indicator has been posting stronger gains over the past three months, pointing to a stronger housing market. In March, the indicator jumped 4.4%, its biggest gain since September 2013.
- Private Sector Credit: Friday, 1:30. Credit levels are important because an increase in borrowing usually translates into stronger consumer spending. The indicator has been very steady, posting gains of 0.5% in four of the past five readings.
* All times are GMT.
AUD/USD Technical Analysis
AUD/USD started the week at 0.8043 and quickly touched a high of 0.8045. The pair then dropped sharply, touching a low of 0.7801, as support managed to hold firm at 0.7799 (discussed last week). The pair closed the week at 0.7814.
Live chart of AUD/USD: [do action=”tradingviews” pair=”AUDUSD” interval=”60″/]
Technical lines from top to bottom:
We begin with resistance at 0.8393, which has held firm since December 2014.
0.8295 has remained intact since mid-January.
0.8150 remains a strong resistance line.
0.8077 was an important resistance line in January.
0.7978 is the next line of resistance.
0.7901 was an important cap in March.
0.7799 held firm as the pair posted sharp losses during late in the week and touched a low of 0.7801.
0.7692 is the next support level.
0.7601 has remained firm since mid-April.
0.7528 is the final support level for now.
I am bearish on AUD/USD.
Even with lukewarm US numbers last week, the Aussie couldn’t buy a break against the greenback. Is AUD/USD headed towards the US 75 cent level? A sharp divergence in monetary stance between the Fed and the RBA will likely weigh on the pair.
In our latest podcast, we discuss commodity currencies, oil hedging and preview next week’s events.
Subscribe to Market Movers on iTunes
Further reading:
- For a broad view of all the week’s major events worldwide, read the USD outlook.
- For EUR/USD, check out the Euro to Dollar forecast.
- For GBP/USD (cable), look into the British Pound forecast.
- For the Japanese yen, read the USD/JPY forecast.
- For USD/CAD (loonie), check out the Canadian dollar forecast.
- For the kiwi, see the NZDUSD forecast.
