AUD/USD posted modest losses for a second straight week, as the pair closed just above the 0.73 level. This week has just four events, highlighted by Private Capital Expenditure. Here is an outlook on the major market-movers and an updated technical analysis for AUD/USD.
The Fed minutes brought more uncertainty to the timing of a rate hike, as the Fed is clearly hesitant about raising rates in September. US employment numbers were steady and housing numbers beat expectations. There were no major numbers out of Australia last week.
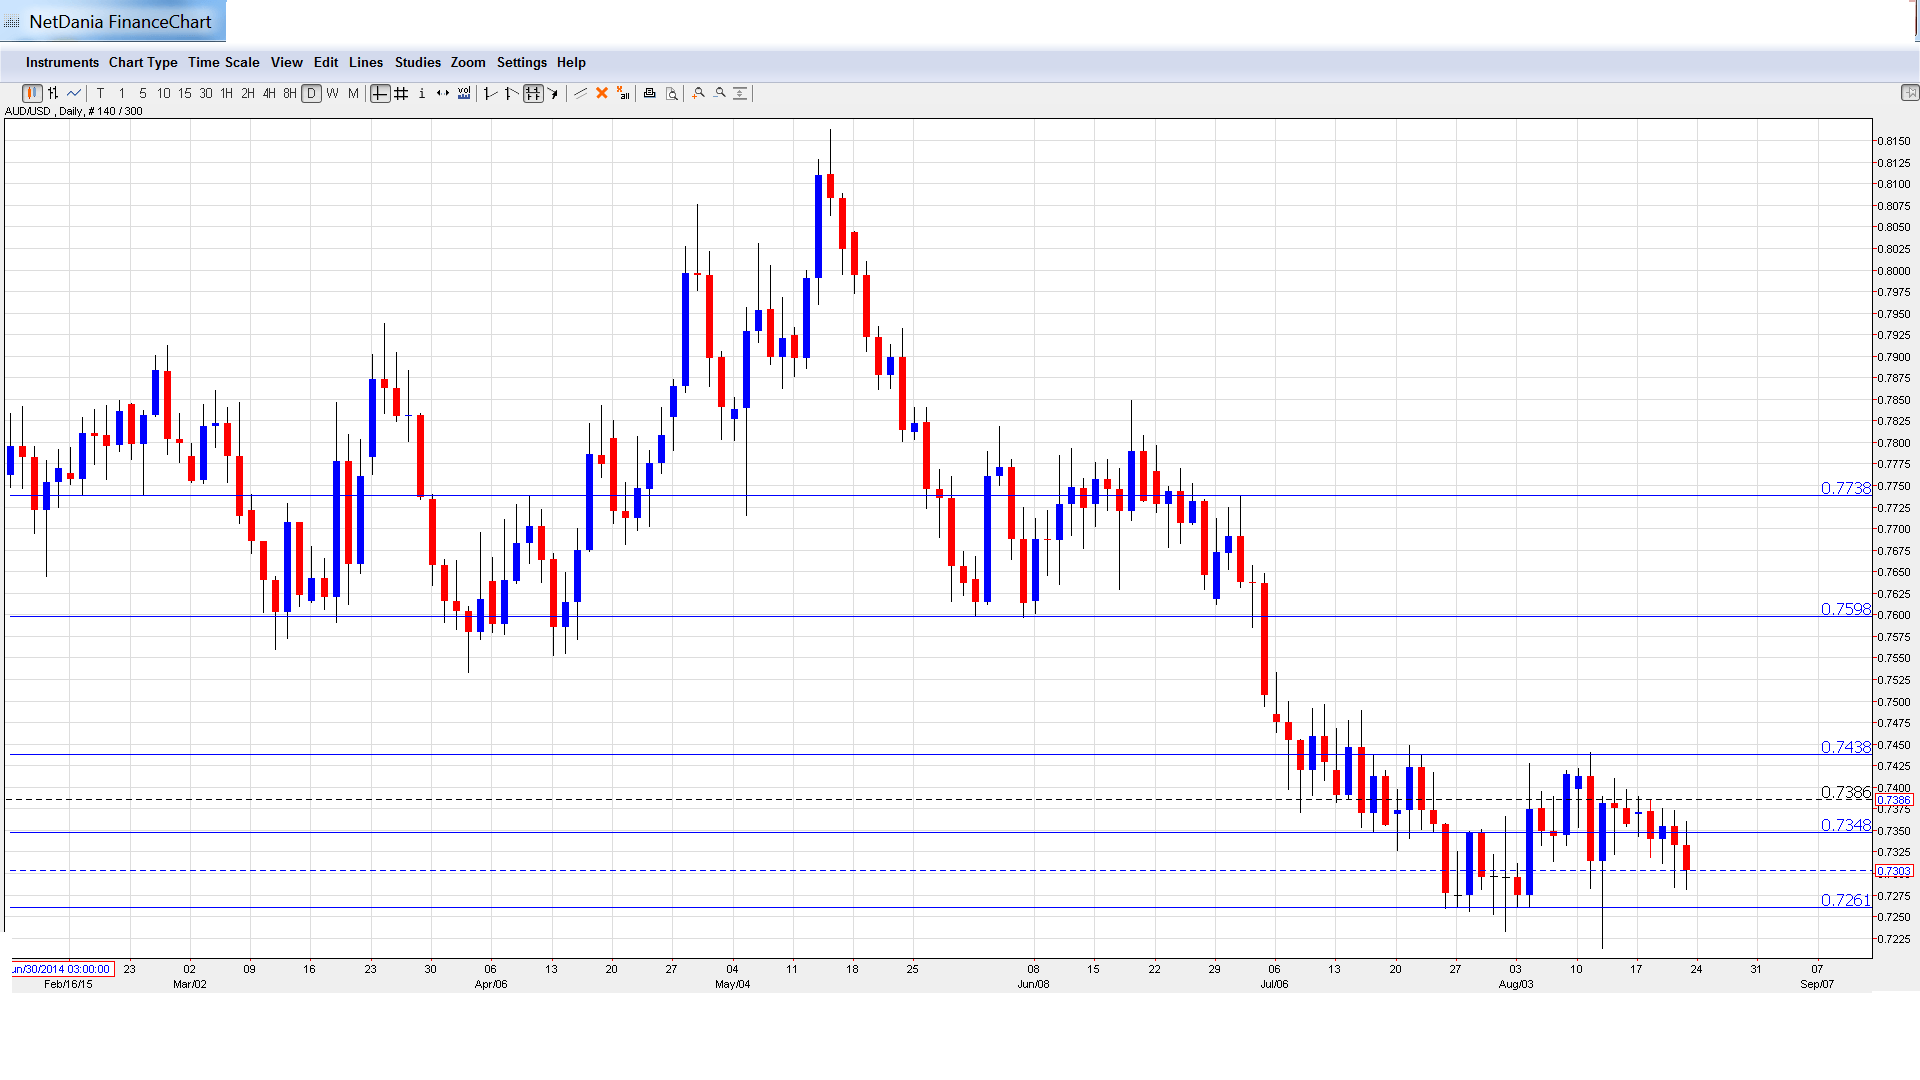
[do action=”autoupdate” tag=”AUDUSDUpdate”/]AUD/USD graph with support and resistance lines on it. Click to enlarge:
- CB Leading Index: Tuesday, 00:00. The index is based on 7 economic indicators, but is considered a minor event since most of the data has already been released. The indicator posted a gain of 0.2% in May, after posting two consecutive declines.
- Construction Work Done: Wednesday, 1:30. This indicator continues to struggle, having posted 4 straight declines. The Q1 release was dismal, with a reading of -2.4%. This was well off the forecast of -1.5%. The markets are predicting another reading of -1.5% for the Q2 report.
- RBA Governor Glenn Stevens Speaks: Wednesday, Tentative. Stevens will deliver a speech in Sydney. If his remarks are more bullish than expected, the Aussie could gain some ground.
- Private Capital Expenditure: Thursday, 1:30. The week wraps up with this event, a key business indicator. The indicator has looked awful, posting two consecutive sharp declines. The Q1 reading was -4.4%, the worst showing in five quarters. It was also way off the estimate of -2.3%. Another decline is anticipated in the Q2 report, with a forecast of -2.5%.
* All times are GMT.
AUD/USD Technical Analysis
AUD/USD opened the week at 0.7368 and quickly touched a high of 0.7389. The pair then softened, dropping as low as 0.7281, as support held at 0.7266 (discussed last week). AUD/USD closed the week at 0.7303.
Live chart of AUD/USD: [do action=”tradingviews” pair=”AUDUSD” interval=”60″/]
Technical lines from top to bottom:
We begin with resistance at 0.7738. This marked the starting point of a US dollar rally in early July.
0.7597 was an important support level in June.
0.7438 marked the start of a recent greenback rally, which saw the pair dip below the 0.73 line.
0.7346 was an important cap in July 2004.
0.7266 continues to be busy and held firm in support as the Aussie softened last week. It remains an immediate line of support.
0.7113 has held firm since April 2009.
0.7011 was a key support level in March 2006. It is protecting the symbolic line of 0.70.
0.6931 is the final support line for now.
I am bullish on USD/AUD
The Chinese slowdown is having global repercussions, and the Australian economy, which is heavily dependent on the Asian giant, is first in the firing line if the China continues to post additional weak numbers. As well, the RBA convenes on September 1st to make its monthly rate decision, and a cut in rates would likely hurt the Australian dollar.
In our latest podcast we collect the crashes: commodities, Fed hike and later Greece
Further reading:
- For a broad view of all the week’s major events worldwide, read the USD outlook.
- For EUR/USD, check out the Euro to Dollar forecast.
- For the Japanese yen, read the USD/JPY forecast.
- For GBP/USD (cable), look into the British Pound forecast.
- For the Canadian dollar (loonie), check out the Canadian dollar forecast.
- For the kiwi, see the NZDUSD forecast.
