AUD/USD lost close to 100 points last week, as the pair closed at 0.6854. AUD/USD is currently trading at its lowest levels since March 2009. There are six indicators this week. Here is an outlook on the major market-movers and an updated technical analysis for AUD/USD.
The Aussie posted sharp gains late in the week, following disappointing retail sales and inflation numbers out of the US. Australian employment numbers met expectations, but this was not enough to prevent AUD/USD from taking a tumble last week.
- MI Inflation Gauge: Sunday, 23:30. This monthly indicator helps analysts track CPI, which is released each quarter. The indicator remains weak, and posted a small gain of 0.1% in November.
- New Motor Vehicle Sales: Monday, 00:30. An increase in the purchase of motor vehicles is indicative of stronger consumer confidence, which is important for economic growth. The indicator bounced back in November with a strong gain of 1.0%.
- Chinese GDP: Tuesday, 2:00. Chinese key indicators can have a strong impact on the Australian dollar, as China is Australia’s largest trading partner. Chinese GDP slipped below the 7.0% level in Q3, coming in at 6.9%. An identical reading is expected in Q4.
- Chinese Industrial Production: Tuesday, 2:00. This manufacturing indicator jumped by 6.2% in November, well above the forecast of 5.7%. Another strong reading is expected in the January report, with an estimate of 6.0%.
- Westpac Consumer Sentiment: Tuesday, 23:30. An increase in consumer confidence usually translates into stronger consumer confidence, a key driver of economic growth. The indicator reversed directions in December, posting a decline of -0.8%.
- MI Inflation Expectations: Thursday, 00:00. This indicator is closely monitored by the markets, as inflation expectations help analysts predict actual inflation trends. The indicator jumped 4.0% in November, its highest gain since January. Will the upward trend continue in December?
* All times are GMT.
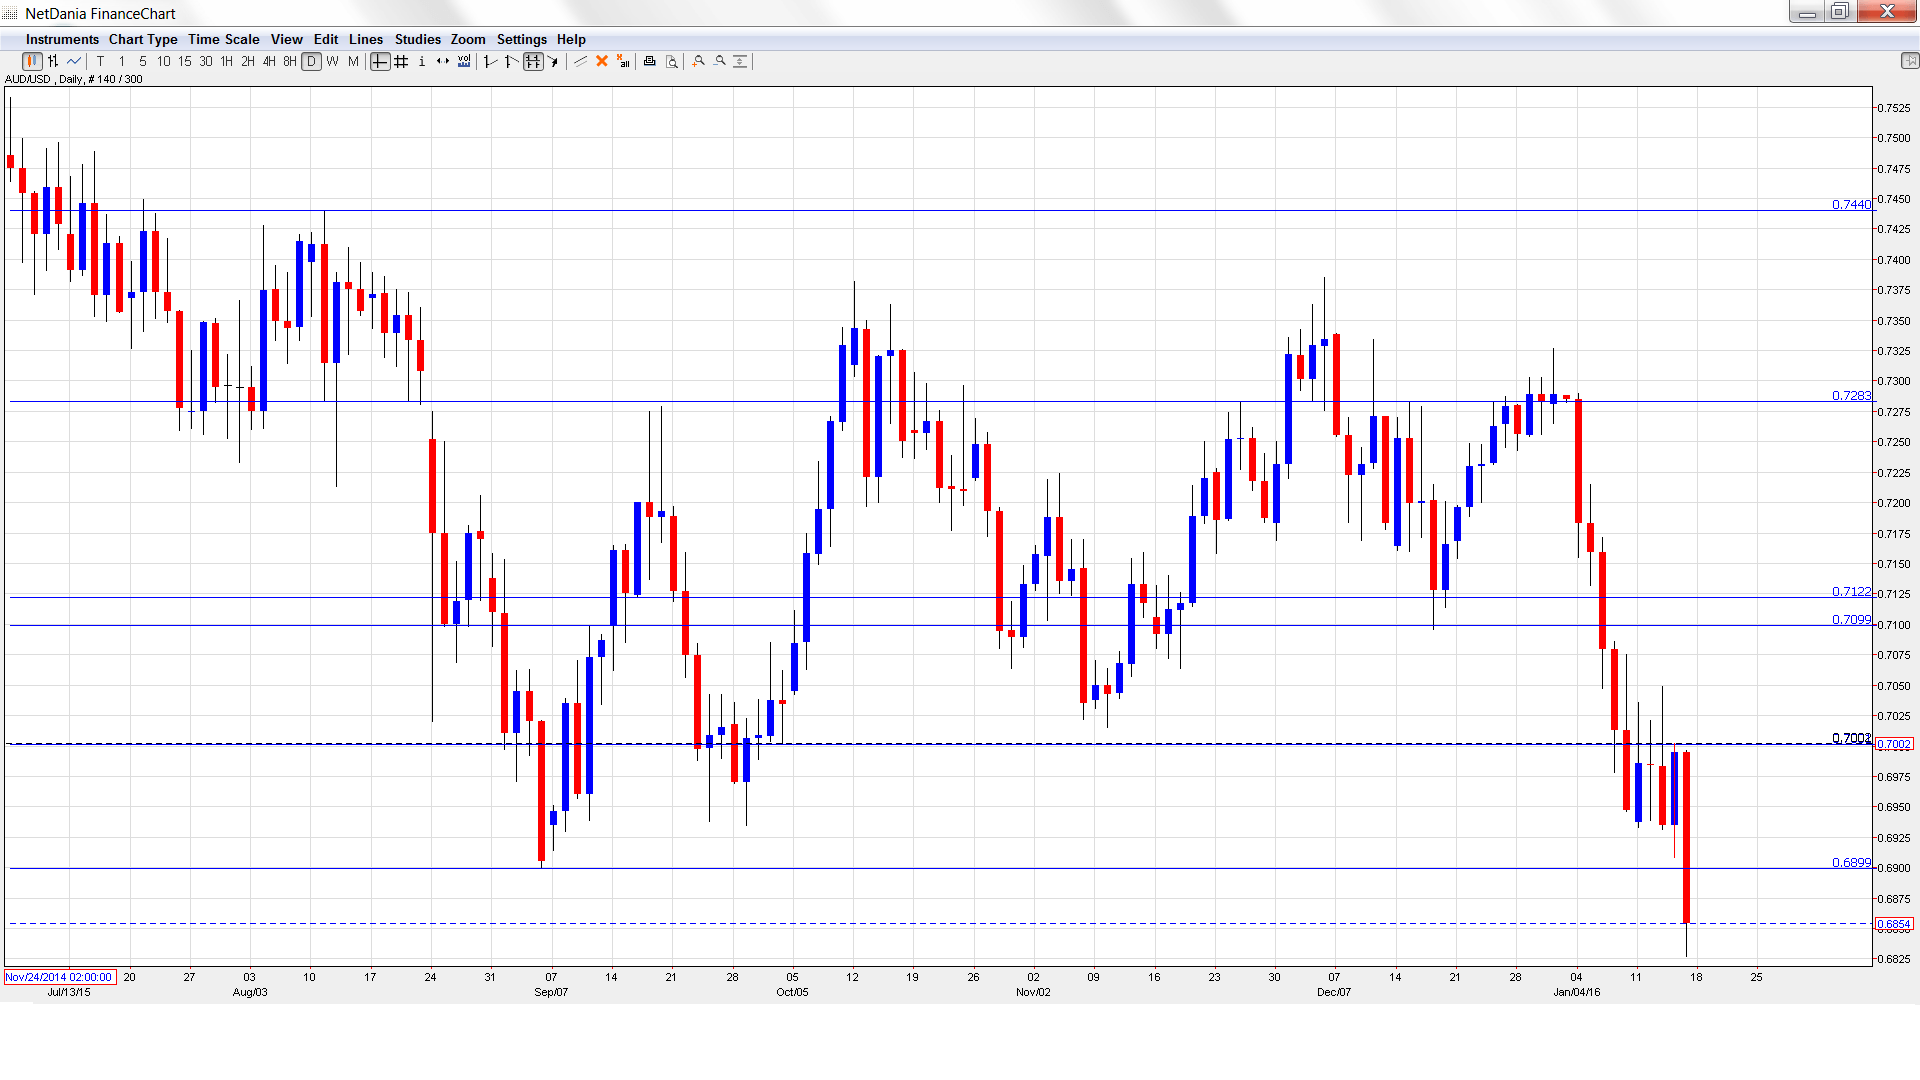
AUD/USD Technical Analysis
AUD/USD opened the week at 06937. The pair quickly touched a high of 0.7049, before reversing directions and sliding to a low of 0.6827, as support held at 0.6775 (discussed last week). The pair closed the week at 0.6854.
Live chart of AUD/USD: [do action=”tradingviews” pair=”AUDUSD” interval=”60″/]
Technical lines from top to bottom:
With the Australian dollar posting huge losses, we start at lower levels:
0.7440 capped the pair in August.
0.7284 is next.
The pair easily breached below the 0.71 line.
The round number of 0.70 worked as a cushion in August. It was also breached and has switched to a resistance role.
0.6899 has provided support since September. It is a weak line.
0.6775 is the next support level.
0.6686 was an important cap back in January 2000.
0.6532 is the final support level for now.
I am bearish on AUD/USD
The slowdown in China and weak US figures continue to weaken the Aussie, which is trading at multi-year lows. The Fed may delay the next hike, but the US economy is outperforming that of Australia, putting pressure on the Aussie.
In our latest podcast we explain China and grill the Fed
Follow us on Sticher or on iTunes
Further reading:
- For a broad view of all the week’s major events worldwide, read the USD outlook.
- For EUR/USD, check out the Euro to Dollar forecast.
- For the Japanese yen, read the USD/JPY forecast.
- For GBP/USD (cable), look into the British Pound forecast.
- For the Canadian dollar (loonie), check out the Canadian dollar forecast.
- For the kiwi, see the NZD/USD forecast.
