The AUD/USD reversed directions last week, losing some 230 points. AUD/USD closed the week at 0.7636. It’s a very busy week ahead, with 13 events on the calendar. Here is an outlook on the major market-movers and an updated technical analysis for AUD/USD.
The dollar got a boost from strong core durables data out of the US and managed to weather weak GDP and employment numbers. In Australia, Private Capital Expenditure was unexpectedly weak, posting a sharp decline.
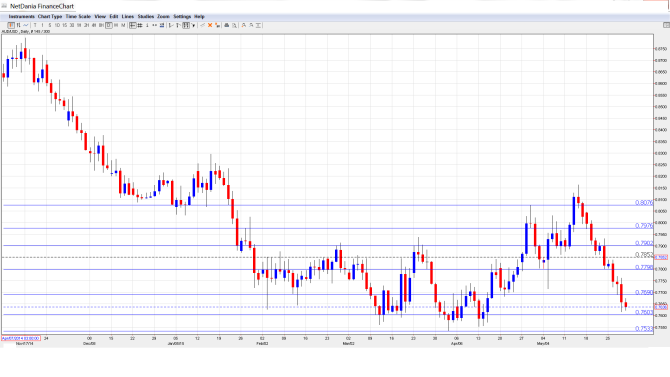
[do action=”autoupdate” tag=”AUDUSDUpdate”/]AUD/USD graph with support and resistance lines on it. Click to enlarge:
- AIG Manufacturing Index: Sunday, 23:30. The index continues to post readings below the 50-point level, indicative of ongoing contract in the manufacturing sector. The April reading improved to 48.0 points, up from 46.3 points in the previous release.
- MI Inflation Gauge: Monday, 00:30. This indicator helps analysts track consumer inflation on a monthly basis, as CPI, the primary gauge of consumer inflation, is only issued each quarter. The indicator showed little change in April, posting a gain of 0.3%.
- Chinese Manufacturing PMI: Monday, 1:00. The Aussie is sensitive to key Chinese data such as PMIs, as China is Australia’s number one trading partner. The index continues to hover close to the 50-point level, and has posted two straight readings of 50.1 points. More of the same is expected in the May report.
- Building Approvals: Monday, 1:30. This is the first major Australian event of the week. The indicator tends to show sharp movement, which often leads to readings that are well off the forecasts. This was the case in March, which saw an excellent gain of 2.8%, much stronger than the estimate of -1.7%. The estimate for the April reading remains unchanged at -1.7%.
- Chinese HSBC Final Manufacturing PMI: Monday, 1:45. The PMI has not posted only one reading above the 50-point line in 2015, indicative of contraction in the Chinese manufacturing sector. The April reading dipped to 48.9 points, short of the forecast of 49.4 points. The estimate for the May report stands at 49.2 points.
- Commodity Prices: Monday, 6:30. Commodity Prices continue to struggle, reflective of weak global demand. The April reading came in at -20.5%, and another sharp decline is expected in the May report.
- Current Account: Tuesday, 1:30. Current Account is closely linked to currency demand, as foreigners need to purchase Australian dollars in order to buy Australian goods and services. The current account deficit improved to A$9.6 billion in Q4, better than the estimate of a deficit of A$10.9 billion. The deficit is expected to rise in Q1, with an estimate of A$10.9 billion.
- Cash Rate: Tuesday, 4:30. The RBA has surprised the markets on more than one occasion with a rate move, so a rate cut is always a possibility. However, the markets are expecting the RBA to maintain rates at an even 2.00% in the upcoming rate announcement.
- AIG Services Index: Tuesday, 23:30. The index slipped below the 50 line (which separates between contraction and expansion) in April, coming in at 49.7 points. Will the indicator push back above the 50 line in the May release?
- GDP: Wednesday, 1:30. GDP, one the most important economic indicators, is the key event of the week. The indicator improved in Q4, posting a gain of 0.5%, within expectations. The markets are expecting the upward trend to continue in Q1, with the estimate standing at 0.6%.
- Retail Sales: Thursday, 1:30. Retail Sales is the primary gauge of consumer spending, and should be treated as a market-mover. The indicator slipped to 0.3%, in March, down from 0.7% in the previous release. The estimate for the April report is 0.3%.
- Trade Balance: Thursday, 1:30. Trade Balance is closely linked to currency demand. The trade deficit rose to A$1.32 billion, well above the forecast of a deficit of A$0.98 billion.
- AIG Construction Index: Thursday, 23:30. The index has remained below the 50-point line for most of 2015, indicative of contraction in the construction sector. The index slipped to 47.0 points, down from 50.1 points a month earlier.
* All times are GMT.
AUD/USD Technical Analysis
AUD/USD started the week at 0.7811 and quickly touched a high of 0.7840. The pair then dropped sharply, touching a low of 0.7616, as support managed to held firm at 0.7601 (discussed last week). The pair closed the week at 0.7636.
Live chart of AUD/USD: [do action=”tradingviews” pair=”AUDUSD” interval=”60″/]
Technical lines from top to bottom:
With the pair posting sharp losses, we start at lower levels:
0.8077 was an important resistance line in January.
0.7978 is the next line of resistance.
0.7901 was an important cap in March.
0.7799 has switched to a resistance line following sharp losses by the Aussie.
0.7692 is an immediate resistance line, after providing support last week.
0.7601 held firm last week and is a weak support line.
0.7528 is the next support level.
0.7403 has remained intact since May 2009. At that time, the Aussie was in the midst of a rally which saw it climb above the 0.94 line.
The final support line for now is 0.7283.
I am bearish on AUD/USD.
The sagging Aussie has given up about 400 points in the past two weeks, despite lukewarm US data. Sharp divergence in monetary stance between the Fed and the RBA continues to weigh on the pair and the symbolic US 75 cent level is within striking distance.
In our latest podcast, we explain the recent USD rally, what’s ahead and lots more
Subscribe to Market Movers on iTunes
Further reading:
- For a broad view of all the week’s major events worldwide, read the USD outlook.
- For EUR/USD, check out the Euro to Dollar forecast.
- For GBP/USD (cable), look into the British Pound forecast.
- For the Japanese yen, read the USD/JPY forecast.
- For USD/CAD (loonie), check out the Canadian dollar forecast.
- For the kiwi, see the NZDUSD forecast.
