AUD/USD softened late in the week, and lost about 80 points over the week. The pair closed the week at 0.7746. It’s a busy week ahead, with 11 events on the calendar. Here is an outlook on the major market-movers and an updated technical analysis for AUD/USD.
In the US, Final GDP posted a slight decline, but housing numbers were strong, and the week ended with excellent consumer sentiment data. The Australian dollar softened on weak Chinese manufacturing numbers. The crash of the Chinese stock market also had a negative impact on the Aussie.
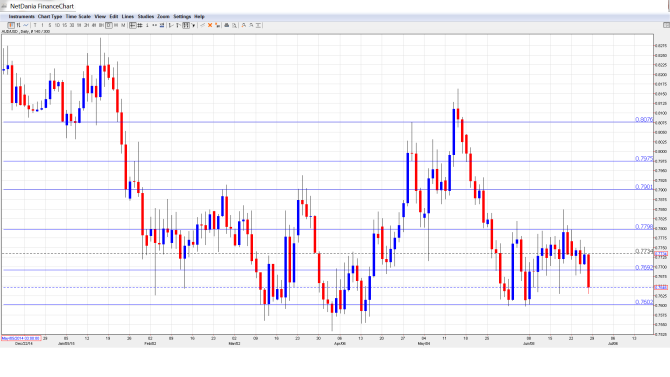
[do action=”autoupdate” tag=”AUDUSDUpdate”/]AUD/USD graph with support and resistance lines on it. Click to enlarge:
- HIA New Home Sales: Tuesday, 1:00. This indicator provides a snapshot of the housing sector. The indicator has posted gains for four straight readings, but the April reading slipped to just 0.6%, marking a 4-month low.
- Private Sector Credit: Tuesday, 1:30. Borrowing is correlated with spending, as higher credit levels usually translates into increased spending. The indicator softened in the May report, with a gain of 0.3%. This was the smallest gain since December 2013. Will the indicator improve in the June reading?
- RBA Governor Glenn Stevens Speaks: Tuesday, 8:40. Stevens will speak at a financial forum in London. A speech that is more hawkish than expected is bullish for the Australian dollar.
- AIG Manufacturing Index: Tuesday, 23:30. In May, the index pushed above the 50-point level for the first time in 2015, with a reading of 52.3 points. The markets are hoping for another indication of expansion in the June report.
- Chinese Manufacturing PMI: Wednesday, 1:00. The Australian dollar is sensitive to key Chinese data such as PMIs, as China is Australia’s number one trading partner. The PMI has been hovering just above the 50-point line in recent readings, which separates between contraction and expansion. The estimate for the June report stands at 50.5 points.
- Building Approvals: Wednesday, 1:30. This indicator tends to show strong fluctuations, leading to readings that are often well off the estimates. The indicator looked terrible in May, with a reading of -4.4%. This was much lower than the estimate of -1.7%. The markets are expecting a strong turnaround in the June reading, with a forecast of 1.1%.
- Chinese HSBC Final Manufacturing PMI: Wednesday, 1:45. The PMI has posted only one reading above the 50-point line in 2015, indicative of ongoing contraction in the manufacturing sector. The May release came in at 49.2 points, matching the forecast. The estimate for the June report stands at 49.6 points.
- Commodity Prices: Wednesday, 6:30. With global demand for Australian raw materials at low levels, commodity prices continue to fall. The May reading came in at -19.5%, and more of the same is likely in the June report.
- Trade Balance: Thursday, 1:30. Trade Balance is closely linked to currency demand, as foreigners must buy Australian dollars in order to purchase Australian exports. Monthly trade deficits have been increasing throughout 2015, and the April deficit ballooned to A$3.89 billion, much higher than the estimate of A$2.17 billion. The markets are expecting a deficit of A$2.21 billion in the May report.
- AIG Services Index: Thursday, 23:30. The index has hovered close to the 50-point level for most of 2015, and came in at 49.6 points in the May reading. Will the indicator push above the 50 mark in the June report?
- Retail Sales: Friday, 1:30. The week wraps up with Retail Sales, which is the primary gauge of consumer spending. The indicator slipped in April, posting a flat reading of 0.0%. This was short of the estimate of 0.4%. The markets are expecting better news in the May release, with an estimate of 0.5%.
* All times are GMT.
AUD/USD Technical Analysis
AUD/USD opened the week at 0.7766 and climbed to a high of 0.7796, as support held firm at 0.7798 (discussed last week). The pair dropped sharply late in the week, touching a low of 0.7630. AUD/USD closed the week at 0.7646.
Live chart of AUD/USD: [do action=”tradingviews” pair=”AUDUSD” interval=”60″/]
Technical lines from top to bottom:
We start with 0.8077, which was an active line in May.
0.7978 is the next line of resistance.
0.7901 was an important cap in March. This line held firm as the pair softened before recovering.
0.7798 was tested during the week and remains a weak resistance line. It could see further action early in the week.
0.7692 is providing immediate support. It was tested last week as the pair lost ground before recovering.
0.7601 is a strong support level.
0.7528 is the next support line.
0.7403 has remained intact since May 2009. At that time, the Aussie was in the midst of a rally which saw it climb above the 0.94 line.
The final support line for now is 0.7283.
I am bearish on AUD/USD.
The FOMC may be slightly more hawkish than perceived, as a Fed policymaker spoke of one or even two rate hikes in 2015. If there are further hints about a rate hike, the greenback could jump higher. With the Australian economy limping along, there is little chance of a rate hike, so monetary divergence will continue to weigh on the pair.
In our latest podcast, we discuss building on the US recovery, the Greek crisis and EUR, Saudi solar and next week’s events.
Follow us on Stitcher.
Further reading:
- For a broad view of all the week’s major events worldwide, read the USD outlook.
- For EUR/USD, check out the Euro to Dollar forecast.
- For the Japanese yen, read the USD/JPY forecast.
- For GBP/USD (cable), look into the British Pound forecast.
- For the Canadian dollar (loonie), check out the Canadian dollar forecast.
- For the kiwi, see the NZDUSD forecast.
