- Bitcoin price on Friday was nursing losses of around 0.90% through the mid-point of the session.
- Bears extend the move south, following BTC/USD breaking a key near-term supporting ascending trend line to the downside.
- Price sees firm rejection at 61.8% Fibonacci, after it attempted to climb back north.
BTC/USD 60-minute chart
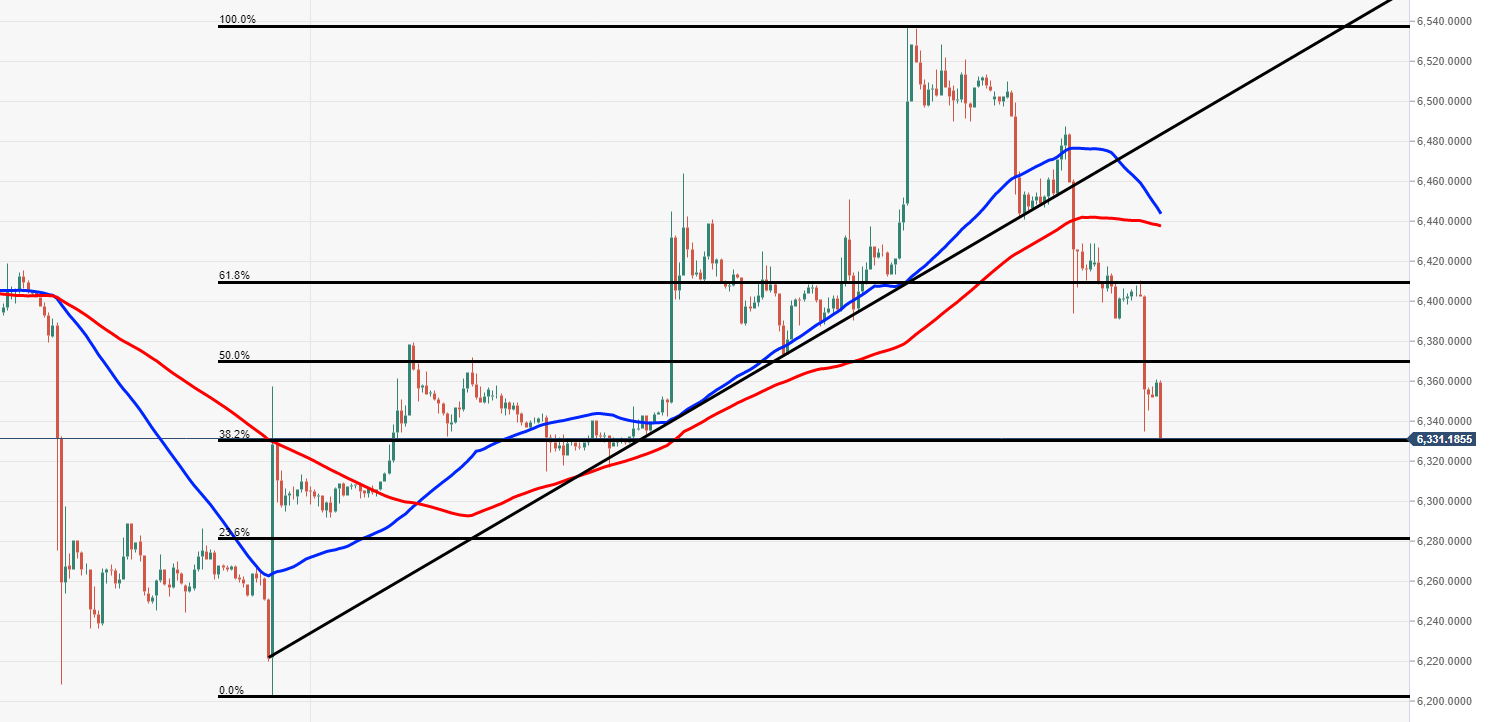
Spot rate: 6342.7
Relative change: -0.91%
High: 6417.5
Low: 6334.5
Trend: Bearish.
Support 1: 6331.0, 38.2% Fibonacci.
Support 2: 6320.6, daily pivot support.
Support 3: 6247.3, daily pivot support.
Resistance 1: 6369.5, 50% Fibonacci.
Resistance 2: 6409.0, 61.8% Fibonacci.
Resistance 3: 6479.7, daily pivot resistance.
