- Bitcoin Cash price nursing minor losses of some 1% well into the second half of the session on Friday.
- BCH/USD technical view can see an evening start formation on the daily, which spells disaster.
- Eyes will be on a possible reversal given the above mentioned candlestick observation.
BCH/USD daily chart
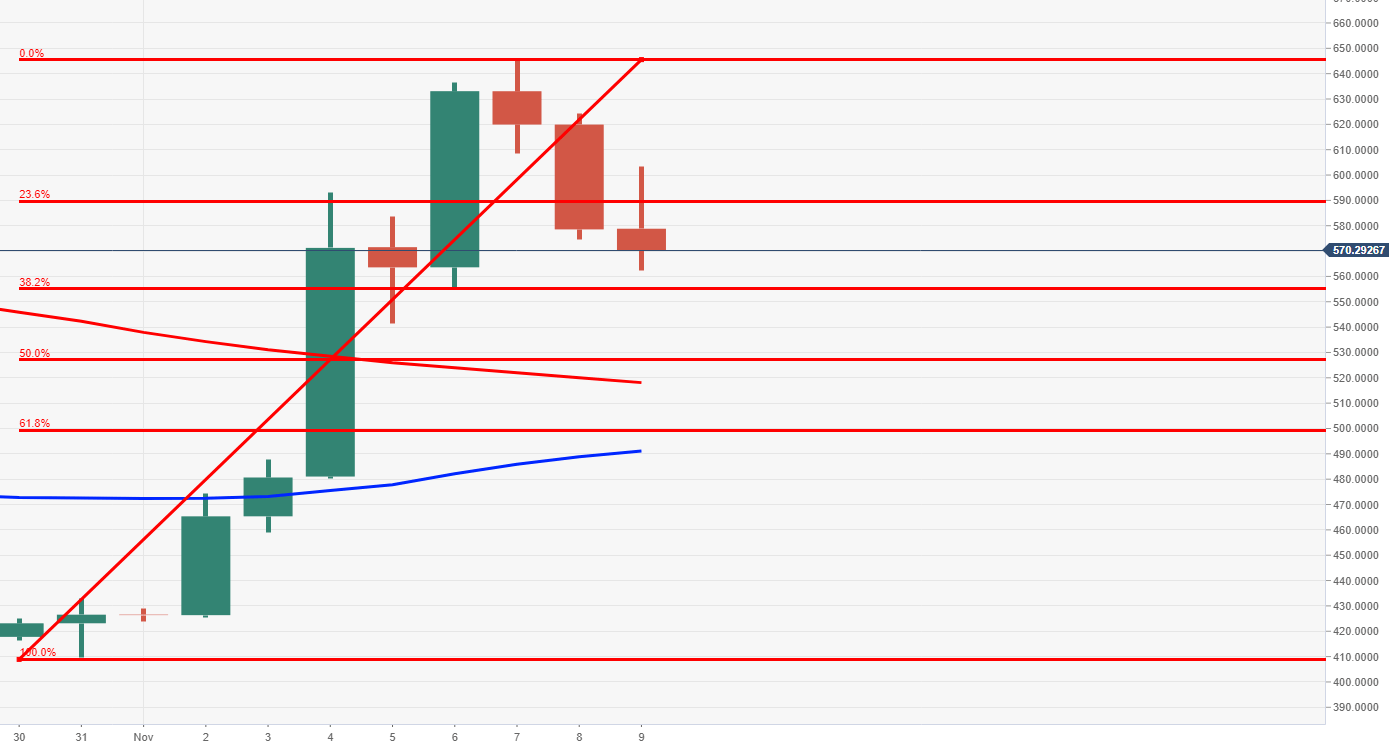
Spot rate: 570.5
Relative change: -0.91%
High: 603.5
Low: 562.5
Trend: Bearish.
Support 1: 555.4, 38.2% Fibonacci & daily support.
Support 2: 517.9, 100DMA.
Support 3: 500.9, 61.8% Fibonacci.
Resistance 1: 589.3, daily resistance & 23.6% Fibonacci.
Resistance 2: 636.7, 6 November high.
Resistance 3: 65.0, supply area.
