Since mid-March, AUD/NZD has been rising steading from 1.0530 to a high last week of 1.1034. Following such a strong 500 pip rise, price has understandably been pulling back. On our analysis, we believe this pullback will provide an opportunity to join another move higher, which should reach the low 1.11s at a minimum.
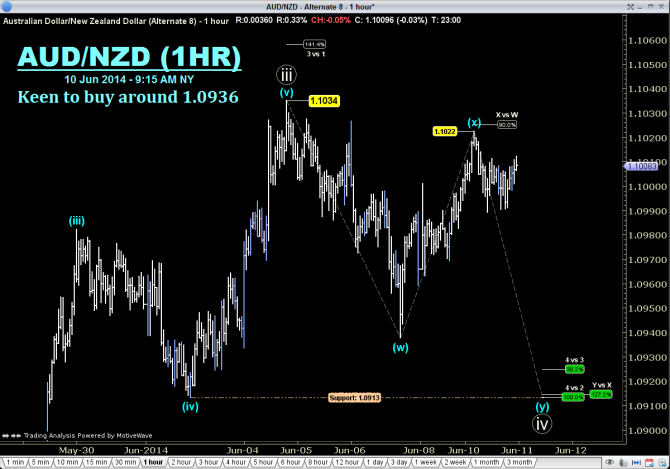
Our hourly chart shows the price action either side of last week’s high. The analysis on this chart is a combination of Elliott Waves and Fibonacci ratios. On our wave count, the recent high was the end of a third wave ‘white circle iii’ and price is currently pulling back as wave ‘white circle iv’. We wish to buy AUD/NZD towards our projected end for this fourth wave.
Guest Post by Todd GORDON of www.TradingAnalysis.com
The chart shows wave ‘white circle iv’ comprising three smaller waves being blue w-x-y in a zigzag pattern. Technically from an Elliott Wave perspective, a zigzag occurs when its second wave (here ‘blue x’) retraces less than 90% of the first wave. The 90% level is marked on the chart and we can see that price came very close to that level but stopped short. Any higher and it would have been a flat.
In our experience, it’s rare that a fourth wave comprises a simple zigzag. Such waves are usually the domain of second wave pullbacks, not fourth wave pullbacks. Therefore, one would reasonably expect this zigzag to be the start of a more complex corrective pattern. Put another way, when we enter this trade, we shouldn’t expect price to rise towards our target either quickly or in a straight line. However, whether this fourth wave is simple or complex, we’re interested in buying AUD/NZD at our projected end of this zigzag and we will need to exercise some degree of patience.
The chart shows our zigzag is projected to end around 1.0915, which is the 127.2% extension of the wave ‘blue x’. What makes this level extremely attractive (relative to other setups) is that other pieces of evidence suggest it may be a key level. Firstly, it’s typical that fourth waves end near the extreme of the prior degree fourth wave. Translated, wave ‘white circle iv’ is more likely to end in the area (from high to low) of wave ‘blue (iv)’ on the left of the chart, which is from 1.0982 to 1.0913. This 1.0913 low (marked as “support”) coincides with our zigzag projection.
Further, there are two very significant green Fibonacci ratios near this level. The first is a 100% ratio labelled “4vs2″ which also occurs near 1.0915. This is the level where the fourth wave pullback would be exactly the same size as the earlier second wave pullback. This is a key Elliott Wave relationship between adjacent pullbacks. Secondly, we have the 38.2% ratio labelled “4v3″ which occurs a few pips higher. This represents the 38.2% retracement of the entire third wave. When these two levels are close to each other, they often see fourth wave pullbacks end in the vicinity.
Based on this information, we still need an entry, a stop and a target. Our entry should occur slightly above all of these key levels (and allow for the AUD/NZD spread), so 1.0936 seems reasonable (i.e. 1.0930 plus a six pip spread). If the wave count is correct, price action for a fourth wave should not move into this area of the first wave. Therefore, we’ll place our stop at 1.0850, so we have an 86 pip stop.
Based on other projections, we’re looking for upside towards the low/mid 1.11s, so we’ll provide two targets in the hope that at least one is achieved. As our stop is 86 pips, we’d like our first target to be at least 150% the size of our stop (i.e. at least 129 pips). This sets our first target at 1.1065 which equates to a risk/reward of 1.5. We’d also like another target nearer 1.11 so we’ll choose 1.1108 which is exactly 172 pips from our entry (double the size of our stop; risk/reward 2.0).
The end of wave ‘white circle v’, the expected move towards the low/mid 1.11s will depend on the size of wave ‘white circle iv’. As it isn’t complete yet, it’s difficult to project this final level. This is another reason why we’ve set two take profit targets. If our wave count is correct, price should reach the first target no matter how deep wave ‘white circle iv’ ends up being. Therefore to manage the trade, if price reaches 1.1065, the stop should be raised from 1.0850 to 1.0936, ensuring that if the second target isn’t met, we won’t take any further losses.
Long Setup for AUD/NZD
“¢ Trade: Buy at (or below) 1.0936.
“¢ Stop Loss: Place stop at 1.0850.
“¢ Take Profit: The two take profit levels are at 1.1065 and 1.1108.
“¢ Trade Management: If price reaches the first take profit target of 1.1065, raise the stop from 1.0850 to 1.0936. Secondly, patience may be required in case of sideways price action after the entry triggers.
