Let us consider the chart below: what do we see?
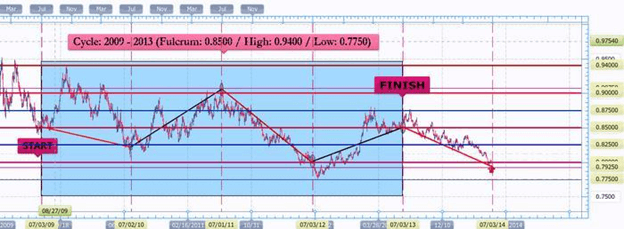
The chart shows the EUR/GBP pair carving a four-year cycle, from (03) July 2009 to (03) July 2013, with black (bullish) and red (bearish) lines joining the start of each July point; the movement shows the following characteristics:
a) the fulcrum, at 0.85(xx), is also (coincidentally) around the middle-way point between the cycle high (0.94(xx)) and low (0.7750); I argue that the next significant movement between July 2014 and July 2015 will be a bullish one, with the pair aiming to exhaust the bearish channel/trend and targeting or surpassing said fulcrum (0.85(xx));
b) some of the July-to-July yearly movements included swings in the direction opposite to the overall movement, and the overall ranges follow a pattern, as listed here (values are approximated to round numbers):
Period A: July 2009 – July 2010: overall range of 1,250 pips;
Period B: July 2010 – July 2011: overall range of 750 pips;
Period C: July 2011 – July 2012: overall range of 1,250 pips;
Period D: July 2012 – July 2013: overall range of 1,000 pips.
The differences are:
A to B = 500 pips;
B to C = 500 pips
C to D = 250 pips.
This regularity shows that the cyclic nature is not a coincidence, as it rests on certain strong boundaries within this pair, given by historic levels/areas of demand (‘support’) and supply (‘resistance’).
What happened between July 2013 and July 2014? Well, the range was of 750 pips, which was the same as in Period B, and we have seen a return to the July 2012 level, in a near-perfect symmetrical triangle, with July 2013 as the apex; what I see now is the following possibility:
1) Stage 1: the pair moves from 0.8000 down to as much as 250 pips, aiming for (but not necessarily achieving) the cycle low at 0.77(50); in an article I wrote last December, I said that
“Another cyclic aspect for this pair finds its fulcrum in the 0.77(xx) figure: this represents the mid way,mathematical half between the lowest level (in 2000) and the highest one (in2008) of the EUR/GBP pair for the last two decades: the July 2012 test of this level (coinciding with our descending channel floor) represents the exact half way point of a retracement of this eight year, c.4,100 pip rise (…)“.
Indeed, if and when we should reach the 0.7750 or 0.7700 level, we would be in an interesting position, but this is where the bullish scenario, long-term, could also play out, as in Stage 2 below;
2) Stage 2: at or before the 0.7750, the pair moves up to aim for the 0.85(xx) level, which is the four-year cycle fulcrum; if the pair moved in reverse, symmetrically, to its first cycle, then we would first need to look at the cycle’s four period movements, end-to-end (i.e. from July to July of each twelve-month part of the cycle):
Period A: BEARISH / 250 pips ;
Period B: BULLISH / 750 pips ;
Period C: BEARISH / 1,000 pips;
Period D: BULLISH / 500 pips.
Reversing this we would have the following:
Period D(1), July 2013 to July 2014: BEARISH / 500 pips;
Period C(1): July 2014 to July 2015: BULLISH / 1,000 pips;
Period B(1): July 2015 to July 2016: BEARISH / 750 pips;
Period A(1): July 2016 to July 2017: BULLISH / 250 pips.
Period D(1) has already come to pass, and it has indeed delivered the 500-pip bearish move; if, therefore we took as true the next move, namely as in Period C(1), we would see the pair aiming to go from 0.80(xx) of the beginning of July 2014 to 0.90(xx) by July 2015, which is the peak at the beginning of July 2011.
Francesco Sani, independent FX trader © 2014
