EUR/USD moved in range and eventually broke higher above downtrend resistance. Is the road to higher levels open? An important German survey and inflation numbers will set the tone. Here is an outlook for the highlights of this week and an updated technical analysis for EUR/USD.
Euro-zone services PMIs showed another slowdown, along the rest of the world and German trade balance also reflected this downturn. The ECB meeting minutes showed willingness to do more, but no real rush. In the US, the meeting minutes showed the decision not to raise rates was not close, and this eventually enabled the euro to join commodity currencies in beating the US dollar.
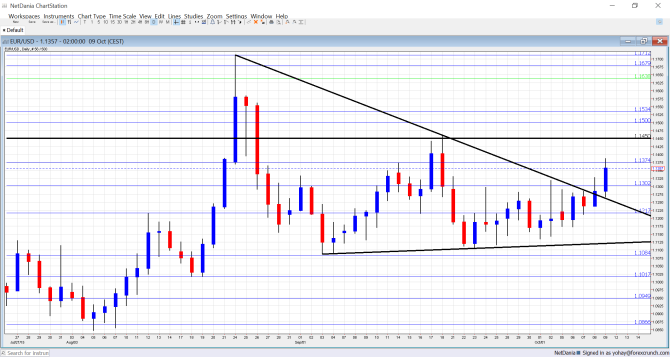
[do action=”autoupdate” tag=”EURUSDUpdate”/]EUR/USD daily graph with support and resistance lines on it. Click to enlarge:
- German inflation numbers: Tuesday, 6:00. The initial read of Germany’s headline CPI inflation showed a drop of 0.2% in prices in September. This figure is expected to be confirmed now. The Wholesale Price Index (WPI) carries expectations for a drop of 0.3% after a big fall of 0.8% in August. This provides information about another part of the chain.
- German ZEW Economic Sentiment: Tuesday, 9:00. This early release for October provides an insight on investors’ mood. The indicator has been falling in the past 6 months, hitting a score of 12.1 in September. This still reflects optimism. But now, with the Volkswagen crisis and the ongoing slowdown in China, the situation could be worse. A slide to 6.8 points is on the cards for October. The all European number carries expectations for a slide from 33.3 to 30.1 points.
- French CPI: Wednesday, 6:45. In August, prices advanced by 0.3% in the continent’s second largest economy. This time, a drop of 0.4% is expected, in line with other countries.
- Industrial Production: Wednesday, 9:00. While the figure is released after the French and German ones, it still has an impact on the euro. A rise of 0.6% was seen in July and turn down of 0.4% is on the cards now.
- Final CPI: Friday, 9:00. According to the flash release, the euro-zone fell back to deflation in September, with a drop of 0.1% in headline CPI. Core CPI still held its ground with +0.9%. The numbers are expected to be confirmed.
- Trade Balance: Friday, 9:00. Germany’s vast exports keep the euro bid during long periods of time. After a surplus of 22.4 billion in July, a slightly lower figure is on the cards for August: 22.2 billion, but it could be even worse given Germany’s miss.
* All times are GMT
EUR/USD Technical Analysis
Euro/dollar began the trading week with a move towards the top of the triangle (mentioned last week). Only towards the end of the week it managed to break higher, but didn’t settle over 1.1375.
Live chart of EUR/USD: [do action=”tradingviews” pair=”EURUSD” interval=”60″/]
Technical lines from top to bottom:
1.1875 was the low seen in 2010 and also capped the pair earlier this year. The August high of 1.1712 is the next line.
1.1680 capped the pair in January on its way down. The next line is a clear separator of ranges: 1.1535. It was last seen in January as well.
The very round 1.15 level is of importance thanks to its psychological role. It is closely followed by 1.1460 that served as resistance earlier in the year.
The historic line of 1.1373 (from November 2003) still has a role as resistance. 1.13, the round number, showed its strength in capping a recovery attempt in early September.
1.1215, which capped the pair both in June and in August is clear resistance. It is followed by a low seen in January of 1.1113 which is nearly 0.90 on USD/EUR.
1.1050 returns to the chart after serving as a stepping stone for the pair to rise to higher ground. 1.0950 is a pivotal line in the range.
1.0865 provided some support in late May and is weak support before a stronger line: 1.0810, which was the bottom in July also nicely coincides with the low seen in May and is strong support..
The next line is 1.0760, which was the low point in both July and August 2003. 1.0715 joins the chart after temporarily capping the pair in April 2015.
Triangle Broken
As the black lines on the chart show, the pair managed to break above the wedge.
I turn from neutral to bearish on EUR/USD
The euro enjoyed the dovish tone of the Fed and the lack of urgency to do more QE from the ECB. However, we know that the ECB is sensitive to the exchange rate and could play a different tune after this rise. In addition, the same factors that worry the Fed already have an impact on Germany. The slide in emerging markets, especially China is taking a toll, and that’s before the VW crisis.
In the latest podcast we explain how no news is bad news for the USD and more:
Follow us on Sticher or on iTunes
Further reading:
- For a broad view of all the week’s major events worldwide, read the USD outlook.
- For the Japanese yen, read the USD/JPY forecast.
- For GBP/USD (cable), look into the British Pound forecast.
- For the Australian dollar (Aussie), check out the AUD to USD forecast.
- USD/CAD (loonie), check out the Canadian dollar forecast
- For the kiwi, see the NZDUSD forecast.
