EURUSD Daily Pivots
| R3 | 1.168 |
| R2 | 1.1477 |
| R1 | 1.1355 |
| Pivot | 1.1153 |
| S1 | 1.1031 |
| S2 | 1.0831 |
| S3 | 1.0707 |
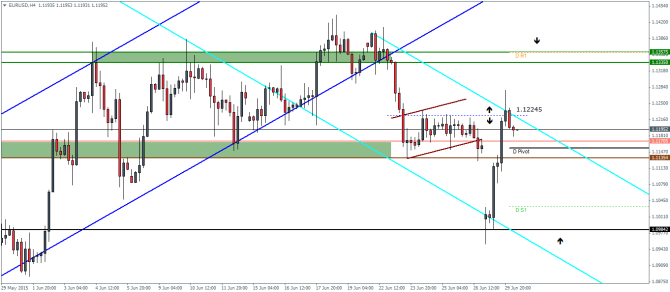
EURUSD (1.119): Despite a weak Monday opening EURUSD closed on a very bullish note, recovering all of its losses and turning positive for the most part. As noted in yesterday’s daily analysis, EURUSD saw a picture perfect bounce off the support at 1.0985 to close back up above the support/resistance level of 1.117 – 1.1135. Subsequent retest to this level is very much a possibility and in the event the support holds the prices, EURUSD could then test the previous resistance at 1.1335. Plotting a new falling price channel, we note that the minor price point at 1.12245 should be a close watch. A close above this level could see a continuation to the upside. Alternatively, should price fail to close above 1.12245, we could expect a decline back to 1.0985 support.
USDJPY Daily Pivots
| R3 | 124.195 |
| R2 | 123.696 |
| R1 | 123.115 |
| Pivot | 122.616 |
| S1 | 122.035 |
| S2 | 121.536 |
| S3 | 120.955 |
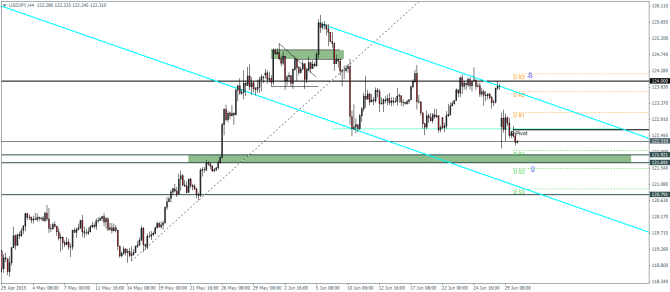
USDJPY (122.3): After opening the week with a down gap, USDJPY is yet to recover its losses. The close below 122.65 has invalidated any potential double or triple bottom pattern. We now look at USDJPY moving sideways, within the range of 124 resistance and support at 122 – 121.7 region. A break below this support could see USDJPY decline lower to 120.8 while a bounce from 122 – 121.7 region could see a potential new rally take shape, provided price breaks the recently broken support at 122.65.
GBPUSD Daily Pivots
| R3 | 1.5919 |
| R2 | 1.5852 |
| R1 | 1.5793 |
| Pivot | 1.5729 |
| S1 | 1.567 |
| S2 | 1.5603 |
| S3 | 1.5544 |
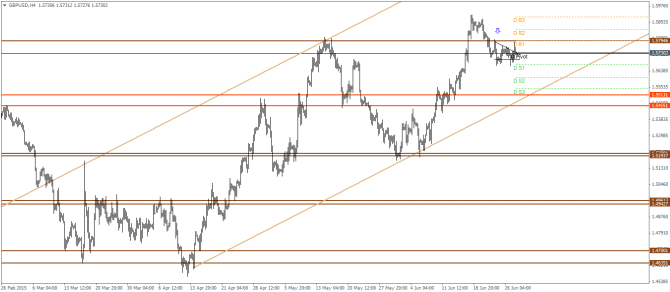
GBPUSD (1.572): The consolidation pattern in the GBPUSD on the daily charts indicates a potential risk for a dip down to 1.552. On the intraday charts, plotting a new rising price channel, we notice that the current swing high failure followed up by the consolidation pattern could indicate a downside bias to test 1.551 – 1.5455 region of support and resistance. With enough room left for this decline, GBPUSD could in fact be looking for a minor correction with the medium term up trend staying intact. The sentiment could however turn bearish should GBPUSD break the rising price channel, which could then see a test of 1.52 after clearing the nearest support at 1.551 – 1.5455.
