EURUSD Daily Pivots
| R3 | 1.1559 |
| R2 | 1.1505 |
| R1 | 1.1408 |
| Pivot | 1.1351 |
| S1 | 1.1257 |
| S2 | 1.1200 |
| S3 | 1.1106 |
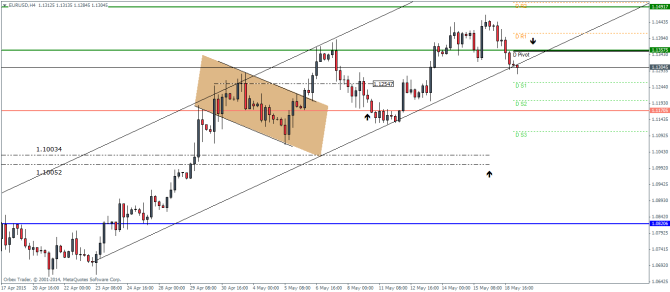
EURUSD (1.1303): EURUSD formed a bearish engulfing candlestick yesterday on the daily charts just short of the 1.148 price level and is currently trading near 1.12845. This support level is crucial as a break below will see a possible decline to 1.11475. On the intraday charts, price is back below the 1.13575 support resistance level. A minor rally to retest this level, which if holds any further rally is likely to send EURUSD lower towards 1.12547 and 1.11705. A break below will see a steeper correction to 1.10034 through 1.10052 regions.
Price action needs to rally above 1.13575 and test for support to eye for further upside gains to 1.14917 as an alternate scenario.
USDJPY Daily Pivots
| R3 | 121.03 |
| R2 | 120.531 |
| R1 | 120.258 |
| Pivot | 119.765 |
| S1 | 119.492 |
| S2 | 118.992 |
| S3 | 118.719 |
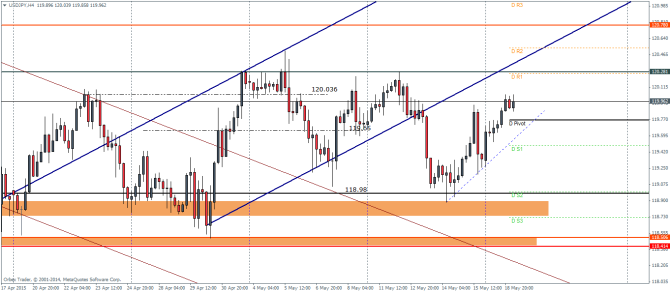
USDJPY (119.95): USDJPY has captured second day of gains after Thursday’s candlestick has formed what looks like a strong bullish doji reversal or morning star. On the intraday charts, USDJPY needs to see a close above 120.036 to target the next resistance at 120.28 and eventually to 120.78 price levels. The minor trend line plotted on the charts is indicative of any potential downside moves, where a break of the trend line should provide an early caution for a possible bearish move in the event the trend line is broken. This scenario will see USDJPY decline back to the previous support at 118.98.
GBPUSD Daily Pivots
| R3 | 1.5825 |
| R2 | 1.5786 |
| R1 | 1.5719 |
| Pivot | 1.5678 |
| S1 | 1.561 |
| S2 | 1.5569 |
| S3 | 1.5504 |
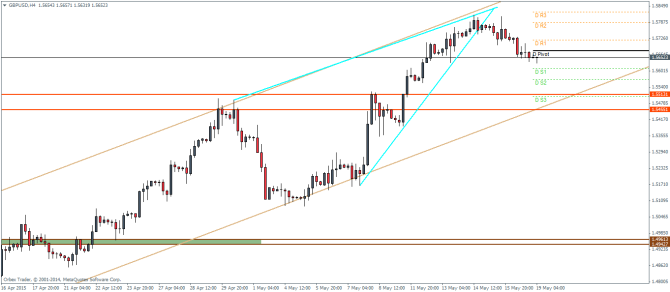
GBPUSD (1.5653): GBPUSD has confirmed the reversal near the 1.57525 price level following up with two days of bearish close. Support on the daily charts comes in at 1.552.
Looking to the intraday charts, price has gradually drifted out from the symmetrical triangle and looks to test the support at 1.5513 through 1.5455. With price still in the ascending channel, a successful test to 1.5513 – 1.5455 for support will see renewed bullish momentum building up in the Cable.
