EURUSD Daily Pivots
| R3 | 1.1438 |
| R2 | 1.1397 |
| R1 | 1.1368 |
| Pivot | 1.1328 |
| S1 | 1.1299 |
| S2 | 1.1258 |
| S3 | 1.1229 |
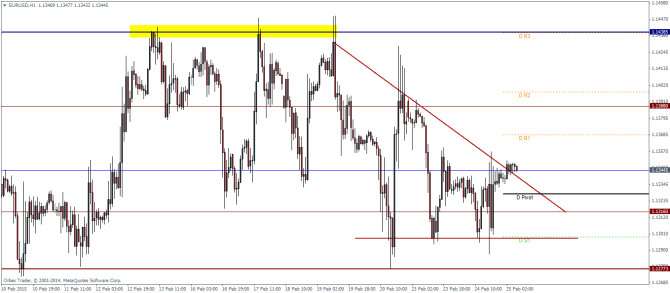
While still staying within the range, EURUSD is starting to show signs of a possible break out to the upside as the falling trend line looks to be breached. We expect a dip down to the daily pivot level, which if holds could then pave way for another attempt to test the 1.1435 levels. However, there are also potential risks considering that price action is shaping up to be a triangle pattern, which also gives a downside target, firstly towards 1.1277 and eventually to 1.114 levels.
USDJPY Daily Pivots
| R3 | 120.693 |
| R2 | 120.261 |
| R1 | 119.617 |
| Pivot | 119.192 |
| S1 | 118.541 |
| S2 | 118.116 |
| S3 | 117.465 |
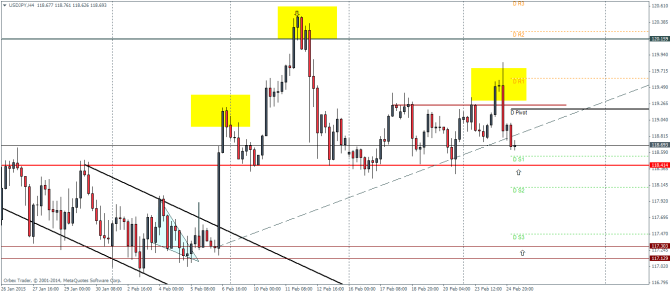
Although a bit distorted, the USDJPY hourly charts do show that the head and shoulders continues to be in play, but requires a break of the neckline in order to achieve the downside objective towards 117 levels. For the moment, with the break of the rising trend line, we can expect a possibility of a rally to the daily pivot level before expecting a decline to the neckline at 118.414 levels. The sharp candlestick reversal pattern near the right shoulder is very indicative of a downside move in place.
GBPUSD Daily Pivots
| R3 | 1.5555 |
| R2 | 1.5514 |
| R1 | 1.5484 |
| Pivot | 1.5442 |
| S1 | 1.5411 |
| S2 | 1.537 |
| S3 | 1.5339 |
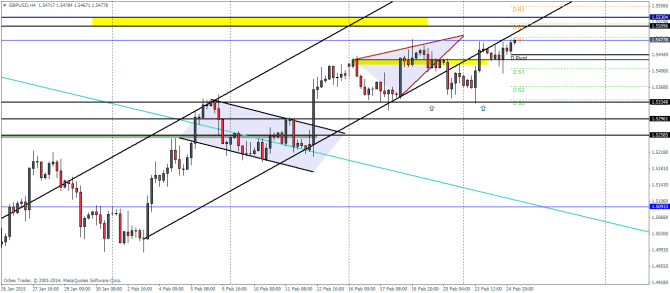
With price barely finding support near the 1.5335 price zone, the reversal and back above the main support at 1.543 is indicative that we could expect a rally towards the main bullish flag’s target of 1.55 through 1.553 price zone. As price did not quite see any close near the downside at 1.533, should price rally to the intended objective, we could potentially be looking at correction from 1.55 levels down to 1.533 levels in the near term.
In this week’s podcast, we cover Questions for traders, State of Fed, Greek crisis, oil, gold and GBP
Subscribe to our iTunes page
