The British pound continued its downward trend last week, as GBP/USD lost about 80 points last week. The pair closed the week at 1.5617. This week’s highlight is Manufacturing PMI. Here is an outlook on the major events moving the pound and an updated technical analysis for GBP/USD.
In the US, the final read of GDP for Q3 was excellent, with a rate of 5% annualized growth. Unemployment Claims looked sharp, but durable goods orders and housing data was rather weak. In the UK, it was a quiet week leading into Christmas and the British markets were closed on Thursday and Friday.
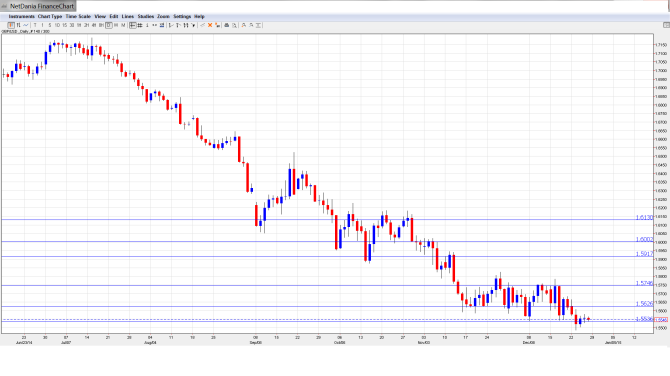
[do action=”autoupdate” tag=”GBPUSDUpdate”/]GBP/USD graph with support and resistance lines on it. Click to enlarge:
- Nationwide HPI: Tuesday, 7:00. This index is an important gauge activity in the housing sector. The indicator slipped to 0.3% in November, shy of the estimate of 0.4%. Another gain of 0.3% is expected in the December reading.
- Housing Equity Withdrawal: Wednesday, 9:30. This indicator, released quarterly, looks at change in value of loans taken for home purchases and repairs. In Q2, the indicator improved to GBP -10.8 billion, beating the estimate of GBP -11.3 billion. The Q3 reading stands at GBP -9.2 billion, which would be the indicator’s best showing in six quarters.
- Manufacturing PMI: Friday, 9:30. Manufacturing PMI is the major event of the week. The index continues to post readings above the 50-point level, which indicates expansion. The November release came in at 53.5 and little change is expected in the upcoming release.
- Net Lending to Individuals: Friday, 9:30. Consumer lending levels are closely monitored, as higher debt levels point to stronger consumer spending. The indicator edged down to GBP 2.6 billion last month, its third straight drop. The downturn is expected to continue, as the estimate for the November reading stands at 2.5 billion.
* All times are GMT
GBP/USD Technical Analysis
GBP/USD opened the week at 1.5627 and quickly climbed to 1.5665. The pair then reversed directions, dropping sharply to a low of 1.5486. GBP/USD then moved higher, closing the week at 1.5546, just above support at 1.5539 (discussed last week).
Live chart of GBP/USD:
[do action=”tradingviews” pair=”GBPUSD” interval=”60″/]Technical lines from top to bottom
We begin with resistance at 1.6130. This line has remained intact since late October.
1.6002 is protecting the psychologically important 1.60 level. This is followed by 1.5912.
1.5746 remains a strong resistance line. It was an important support level in January 2013.
GBP/USD opened the week just above support at 1.5625. This line was easily breached as the pair lost ground and has switched to a resistance role.
1.5539 was tested in support and ended the week just below the pair’s close at 1.5546. The pair could face pressure early in the week.
1.5416 was an important support line in June 2013, at which time the pound broke through and continued to slide and fell below the 1.49 line.
1.5290 was a cushion in July 2013.
1.5114 is the final support line for now. It had remained intact since March 2013.
I am neutral on GBP/USD.
Trading will be light between Christmas and New Year’s, so we’re unlikely to see any significant movement during the week. The US dollar has enjoyed some recent momentum, so we may see the US dollar post slight gains.
In our latest podcast, we run down all aspects of the Fed decision, discuss the running down of oil, the run down Russian ruble and the weak currency down under:
Subscribe to our podcast on iTunes.
Further reading:
- For a broad view of all the week’s major events worldwide, read the USD outlook.
- For EUR/USD, check out the Euro to Dollar forecast.
- For the Japanese yen, read the USD/JPY forecast.
- For GBP/USD (cable), look into the British Pound forecast.
- For the Australian dollar (Aussie), check out the AUD to USD forecast.
- USD/CAD (loonie), check out the Canadian dollar.
