GBP/USD showed some strong movement during the week, but closed the week unchanged, at 1.4240. This week’s highlights are the PMI reports. Here is an outlook on the major events moving the pound and an updated technical analysis for GBP/USD.
The pound jumped on the dollar-selloff bandwagon last week, which followed a disappointing Services PMI out of the US. British PMI reports were mixed.
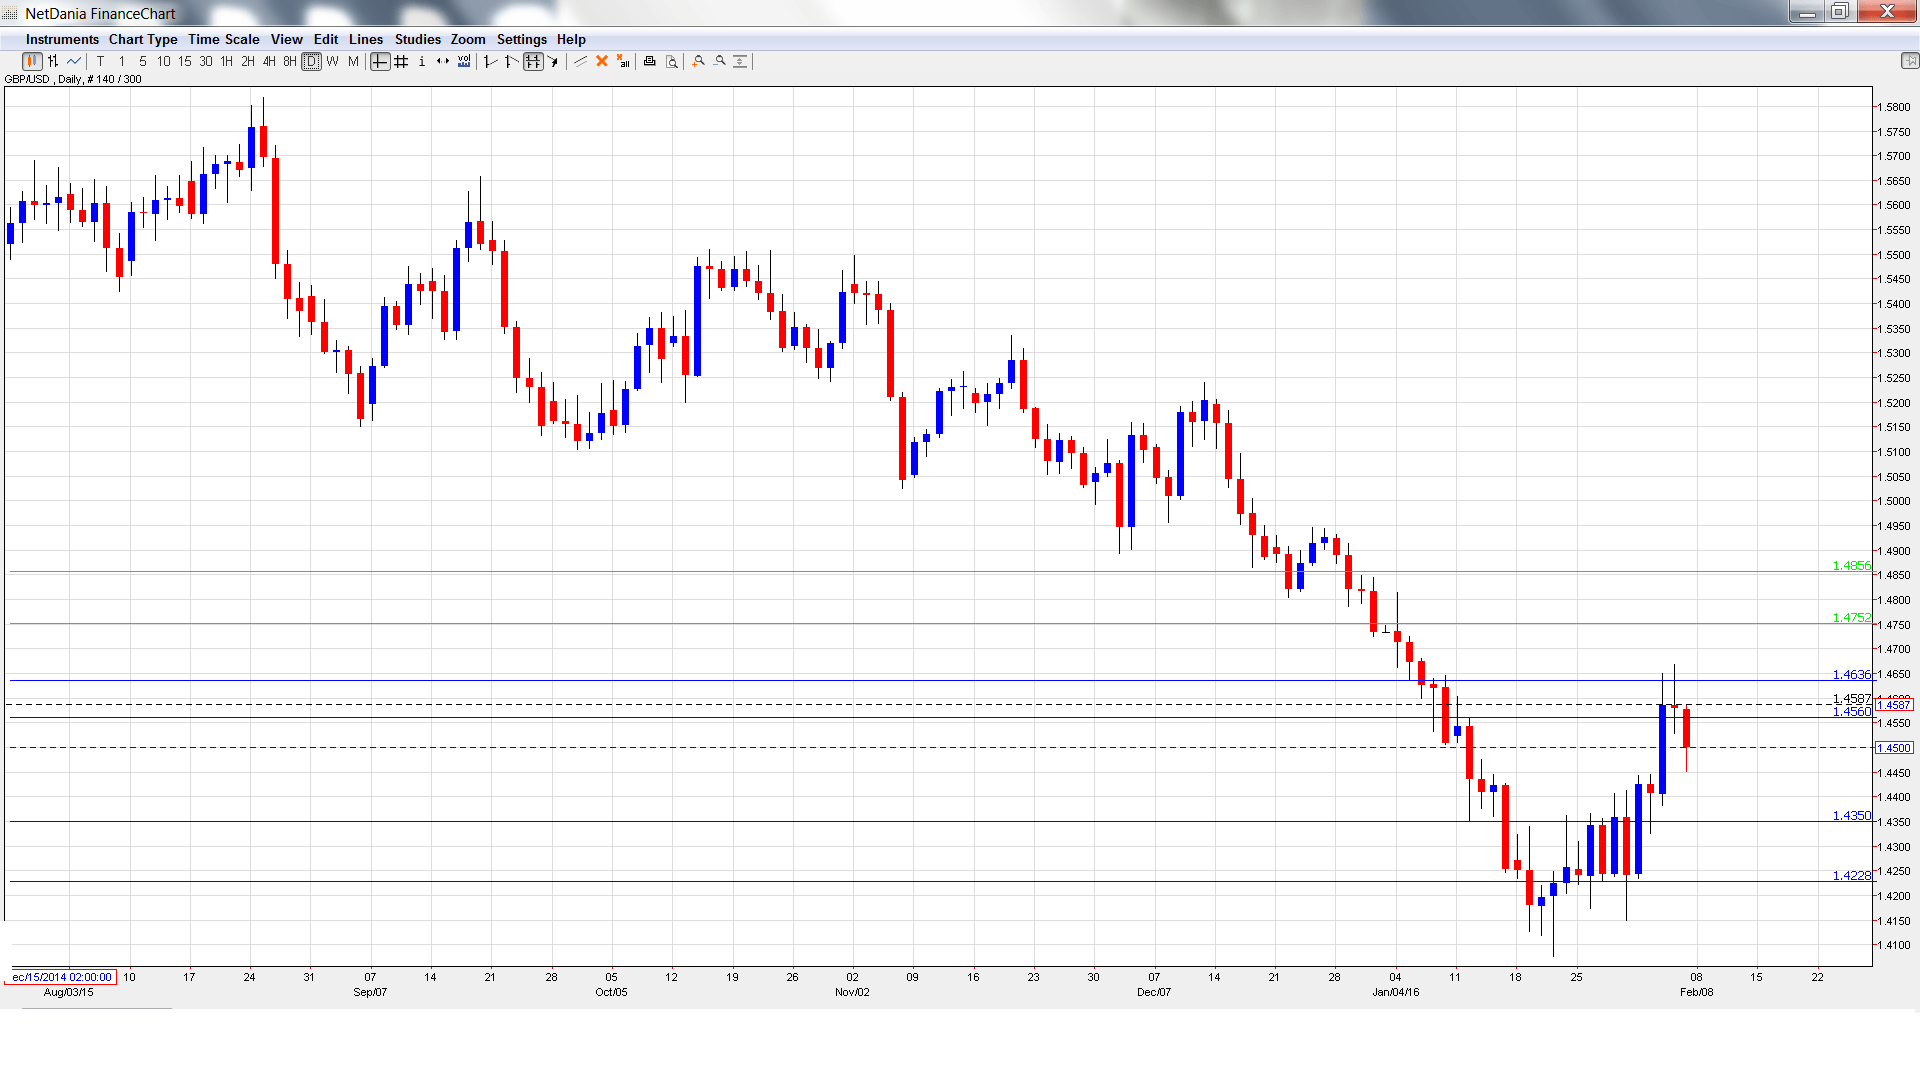
[do action=”autoupdate” tag=”GBPUSDUpdate”/]GBP/USD graph with support and resistance lines on it. Click to enlarge:
- BRC Retail Sales Monitor: Tuesday, 00:01. This indicator measures retail sales, a key consumer spending indicator, in BRC shops.
- Trade Balance: Tuesday, 9:30. The British trade deficit widened in November to GBP 10.6 billion, close to the estimate. The deficit is expected to improve slightly in December, with an estimate of -10.4 billion.
- Manufacturing Production: Wednesday, 9:30. This key indicator can have a significant impact on the movement of GBP/USD. The indicator has posted two straight declines of 0.4%, below expectations each time. The markets are expecting a stronger reading in the December report, with an estimate of 0.0%.
- NIESR GDP Estimate: Wednesday, 15:00. This monthly indicator helps analysts track and predict GDP, which is released each quarter. The indicator has been very steady, with three straight gains of 0.6%.
- RICS House Price Balance: Thursday, 00:01. This indicator provides a snapshot of activity in the housing sector. The indicator edged up to 50% in December, marking a four-month high. The estimate for the January report stands at 52%.
- 30-year Bond Auction: Thursday, Tentative. The yield on 30-year bonds was up slightly in January, coming in at 2.49%. Will the yield rise again in the February auction?
- Construction Output: Friday, 9:30. This indicator has struggled, posting 4 declines in the past 5 months. However, the markets are expecting a strong turnaround in December, with an estimate of 2.1%.
* All times are GMT
GBP/USD Technical Analysis
GBP/USD opened the week at 1.4243 and quickly touched a high of 1.4244. The pair then climbed all the way to 1.4668, testing resistance at 1.4635 (discussed last week). GBP/USD closed the week at the round number of 1.4500.
Technical lines from top to bottom
With the pair posting sharp gains, we start at higher levels:
1.4856 has held firm in resistance since late December.
1.4752 is next.
1.4635 was tested in resistance at the pound posted sharp gains before retracting.
1.4562 is a weak resistance line.
1.4346 has switched to a support role.
1.4227 has some breathing room as the pair trades at higher levels.
1.4135 is the next support level. This line marked a low point in December 2001.
The symbolic level of 1.40 is the final support line. It was last breached in March 2009.
I am neutral on GBP/USD.
With the US economy posting lukewarm numbers of late, the Fed may delay a rate hike until after March. British numbers have not been all that sharp, and low inflation numbers continue to be a concern.
Our latest podcast is titled Americans get a raise, negativity in Japan, Gas Naturally Low
Follow us on Sticher or on iTunes
Further reading:
- For a broad view of all the week’s major events worldwide, read the USD outlook.
- For EUR/USD, check out the Euro to Dollar forecast.
- For the Japanese yen, read the USD/JPY forecast.
- For the kiwi, see the NZD/USD forecast.
- For the Australian dollar (Aussie), check out the AUD to USD forecast.
- For the Canadian dollar (loonie), check out the USD to CAD forecast.
