GBP/USD posted sharp losses last week, as the pair lost 130 points. The pair closed the week at 1.5473. This week’s highlight is Preliminary GDP. Here is an outlook on the major events moving the pound and an updated technical analysis for GBP/USD.
A weak Retail Sales report out of the UK hurt the pound, as the key indicator posted its first decline in three months. Meanwhile, US numbers showed improvement this week, as New Home Sales jumped and unemployment claims dropped sharply.
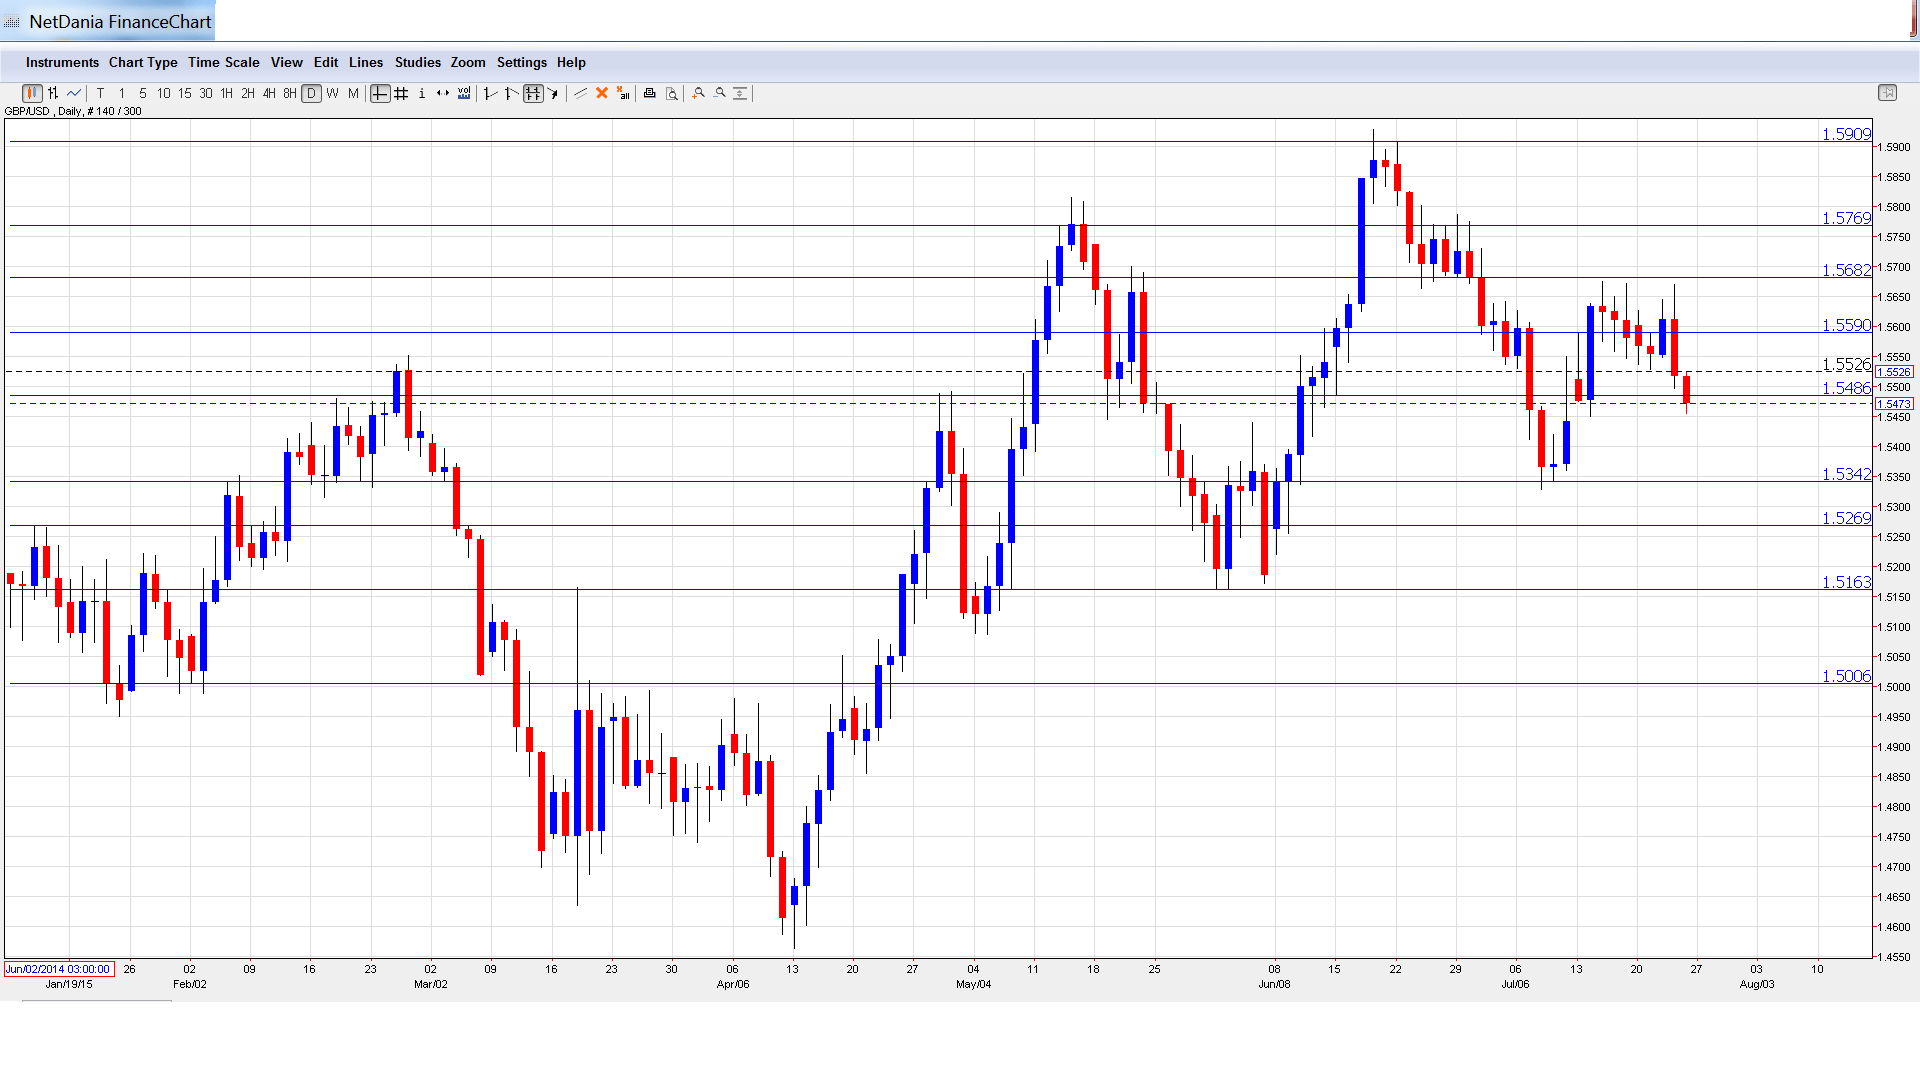
GBP/USD graph with support and resistance lines on it. Click to enlarge:
- CBI Industrial Order Expectations: Monday, 10:00. This manufacturing indicator is struggling, and plunged to -7 points in the June reading, well off the estimate of +1 point. Another weak reading is expected in the July report, with an estimate of -4 points.
- Nationwide HPI: Monday, 27th-30th. This housing inflation indicator provides a snapshot of the level of activity in the UK housing sector. The index came in at -0.2%, in June, well short of the estimate of +0.6%. The forecast for the July report stands at +0.2%.
- Preliminary GDP: Tuesday, 8:30. Preliminary GDP is the earliest of the three GDP reports and tends to have the most impact. The Final GDP reading for Q1 came in at 0.4%, matching the forecast. The estimate for Preliminary GDP in the Q2 report stands at 0.3%.
- Net Lending to Individuals: Wednesday, 8:30. Credit levels are closely linked to consumer spending, which is a critical component of economic growth. The indicator rose to GBP 3.1 billion in the May release, within expectations. Little change is expected in the July report.
- CBI Realized Sales: Wednesday, 10:00. This indicator slipped to 29 points in the June release, compared to 51 points a month earlier The estimate for the July report stands at 31 points.
- GfK Consumer Confidence: Thursday, 23:05. Analysts closely follow this indicator, as consumer confidence usually translates into consumer spending. The indicator improved to 7 points in June, crushing the estimate of 2 points. Another strong reading is expected in July report, with an estimate of 5 points.
* All times are GMT
GBP/USD Technical Analysis
GBP/USD opened the week at 1.5603 and reached a high of 1.5671, as resistance held firm at 1.5682 (discussed last week). The pair then dropped sharply, falling to a low of 1.5456. The pair closed the week at 1.5473.
Live chart of GBP/USD: [do action=”tradingviews” pair=”GBPUSD” interval=”60″/]
Technical lines from top to bottom
We start with resistance at 1.6006, just above the symbolic 1.60 level.
1.5909 has held firm as resistance since November 2013.
1.5769 is the next resistance line.
1.5682 held firm as the pair moved higher before sustaining sharp losses. This line was an important cap in December 2014 and January 2015.
1.5590 is an immediate resistance line.
1.5485 was breached and is currently a weak resistance line. It could see further action early in the week.
1.5341 is the next support line. It has held firm since mid-June.
1.5269 was an important support level in March.
1.5163 is the next support line.
1.5010, just above the symbolic 1.50 level, is the final line of support for now.
I am bearish on GBP/USD.
Last week’s strong housing and job numbers have increased speculation about a rate hike by the Fed, perhaps as early as September. All eyes will be on the Fed policy statement later this week, as any hints about a rate hike could help the US dollar rally even higher against the pound.
In our latest podcast, we drill down the deals, the aGreekment and Iran and the market impact.
Further reading:
- For a broad view of all the week’s major events worldwide, read the USD outlook.
- For EUR/USD, check out the Euro to Dollar forecast.
- For the Japanese yen, read the USD/JPY forecast.
- For the kiwi, see the NZD/USD forecast.
- For the Australian dollar (Aussie), check out the AUD to USD forecast.
- For the Canadian dollar (loonie), check out the USD to CAD forecast.
