GBP/USD sustained sharp losses for a second straight week, losing about 140 points. There are 12 events this week. Here is an outlook on the major events moving the pound and an updated technical analysis for GBP/USD.
US job Nonfarm Payrolls showed a gain 223K jobs in June, a sharp dip from the month before but only slightly below expectations. The unemployment rate dropped more than expected, but wages disappointed. In the UK, Construction and Services PMIs were better than expected, but the pound still lost ground late in the week.
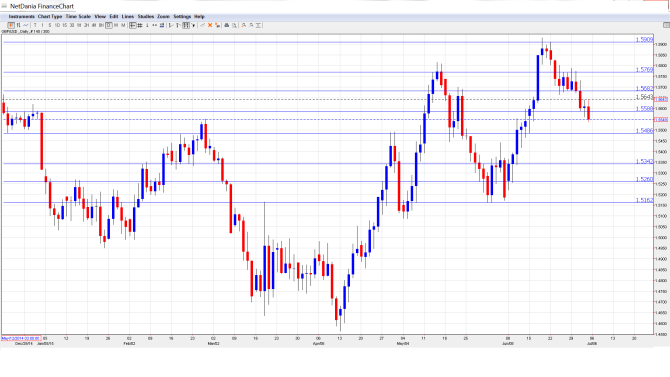
[do action=”autoupdate” tag=”GBPUSDUpdate”/]GBP/USD graph with support and resistance lines on it. Click to enlarge:
- Halifax HPI: Monday, 6th-9th. This housing price indicator provides a snapshot of the level of activity in the UK housing sector. After a strong gain in April, the indicator disappointed with a decline of 0.1% in May. This reading missed the estimate of +0.2%. The forecast for the June report stands at +0.2%.
- Housing Equity Withdrawal: Monday, 8:30. This indicator is released each quarter, magnifying the impact of each release. The indicator slipped to -13.o billion pounds in Q1, well off the estimate of -10.2 billion. This marked the indicator’s worst showing since Q2 of 2013. The estimate for the Q2 release stands at -12.1 billion pounds.
- Manufacturing Production: Tuesday, 8:30. Manufacturing Production is the first key release of the week. The indicator posted a decline of 0.4% in April, well off the forecast of a o.1% gain. This marked the indicator’s weakest performance since January. The markets are expecting better news in the May report, with an estimate of +0.2%.
- 30-year Bond Auction: Tuesday, Tentative. The yield on 30-year bonds rose to 2.86% in the June auction, up from 2.34% in the April release. Will the upswing continue in the July report?
- NIESR GDP Estimate: Tuesday, 14:00. This monthly indicator helps analysts track GDP, as the official GDP releases are only issued each quarter. The indicator improved in the May reading with a 0.6% gain, compared to 0.4% in the previous release.
- BRC Shop Price Index: Tuesday, 23:01. The index measures inflation in BRC shops, and provides a gauge of consumer inflation levels. The indicator continues to post negative readings, and posted declines of 1.9% in the past two readings.
- FPC Meeting Minutes: Wednesday, 9:30. This quarterly report provides details of the BOE’s most recent policy meeting, and analysts will be combing through the minutes looking for clues as to future monetary policy.
- Annual Budget Release: Wednesday, 11:30. The government will announce its spending and income levels in the budget. This event should be treated as a market-mover, as any unexpected items in the budget could affect the movement of GBP/USD.
- RICS House Price Balance: Wednesday, 23:01. This event is a leading indicator of inflation in the housing sector. The indicator continues to rise, pointing to a stronger housing market. The May release came in at 34%, within expectations. The upswing is expected to continue, with an estimate of 37%.
- Official Bank Rate: Thursday, 11:00. The BOE has not altered the benchmark rate of 0.50% since 2009, and no move is expected in the July announcement.
- Asset Purchase Facility: Thursday, 11:00. QE is expected to remain at 375 billion pounds, where it has been pegged since July 2012.
- Trade Balance: Friday, 8:30. Trade Balance is closely connected to currency demand, as foreigners must purchase British pounds in order to buy British exports. The monthly deficit narrowed to GBP 8.6 billion in April, better than the estimate of a GBP 10.0 billion deficit. The markets are braced for a softer reading in the May report, with an estimate of GBP-9.7 billion.
* All times are GMT
GBP/USD Technical Analysis
GBP/USD opened the week at 1.5687, and climbed to a high of 1.5788, testing resistance at 1.5769 (discussed last week). The pair then reversed directions, dropping to a low of 1.5538. GBP/USD closed the week at 1.5549.
Live chart of GBP/USD: [do action=”tradingviews” pair=”GBPUSD” interval=”60″/]
Technical lines from top to bottom
We start with resistance at 1.6131. This line has remained intact since late October.
1.6006 is next, just above the symbolic 1.60 level.
1.5909 has held firm as resistance since November 2013.
1.5769 was tested as the pair started the week with gains before reversing directions.
1.5682 has switched to a resistance role as the pair posted sharp losses last week. This line was an important cap in December 2014 and January 2015.
1.5590 was breached and has reverted to a resistance line. It is a weak line and could see further action early in the week.
1.5485 is an immediate support level.
1.5341 is the next line of support. It has held firm since mid-June.
1.5269 was an important support level in March.
1.5163 is the final support level for now.
I am bearish on GBP/USD.
US data has been mixed, but the Fed seems to be on track for a hike in September, which is bullish for the dollar. The Greek crisis has hurt the pound, and there could be continued fallout even after the Sunday referendum, as Greece’s problems will remain on Monday, whatever the outcome of the vote.
In our latest podcast we feature a Greferendum preview, NFP review and more
Follow us on Sticher.
Further reading:
- For a broad view of all the week’s major events worldwide, read the USD outlook.
- For EUR/USD, check out the Euro to Dollar forecast.
- For the Japanese yen, read the USD/JPY forecast.
- For the kiwi, see the NZD/USD forecast.
- For the Australian dollar (Aussie), check out the AUD to USD forecast.
- For the Canadian dollar (loonie), check out the USD to CAD forecast.
