GBP/USD moved higher this week, as the pound continues to do very well against the dollar in 2012.The pair has benefited from some weak US economic data and the announcement by the Fed that it has no plans to raise interest rates for the foreseable future. As well , there has been some improvement in some economic indicators in the UK, such as solid PMI readings and higher consumer confidence.
Updates: GBP/USD was up sharply on Friday, following the release of the disappointing US GDP reading. The pair is trading at 1.62556. The markets are waiting for the release of Manufacturing PMI, a key indicator, on Tuesday. Manufacturing PMI was slightly below the market forecast, coming in at 50.5 points. This marked the lowpoint for the index this year. The pound was down following this disappointing data, as GBP/USD is trading just above the 1.62 level, at 1.6206. Wednesday was a busy day in the UK, with four releases. Construction PMI, a key indictor, posted a reading of 55.8 points. This was slightly lower than the April reading, but above comfortably above the market forecast of 54.1. M4 Money Supply was a disappointment, coming in at -0.8%. Estimates stood at 0.4%. Mortgage Approvals came in at 50K, slightly above the market forecast of 48K. Net Lending to Individuals was also slightly below the market estimate of 1.5B, recording a reading of 1.4B. GBP/USD was trading below the 1.62 level, at 1.6181. Services PMI disappointed the markets, dropping to a five-month low. The market estimate stood at 54.4., but the index could only muster a reading of 53.3. HPI dropped by 0.2%. This weak reading caught the markets by surprise, as the forecast called for a 0.6% increase.
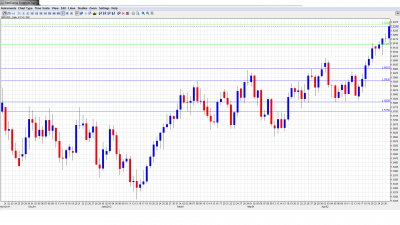
GBP/USD graph with support and resistance lines on it. Click to enlarge:
- Halifax HPI: Publication time tentative. This indicator of inflation in the housing sector hit 2.2% in April, its highest reading since June 2009. The market forecast for May calls for a more modest increase of 1.2%.
- Manufacturing PMI: Tuesday, 8:30. This index has now been slightly above the 50.0 level for three consecutive months, indicating very modest growth in the manufacturing sector. The market forecast calls for a reading of 51.4 in May.
- Construction PMI: Wednesday, 8:30. Construction PMI has been moving steadily upwards, reaching 56.7 in May. This was the best performance by the index since July 2010. However, the markets are predicting a drop in May, with a forecast of 54.2.
- Net Lending to Individuals: Wednesday, 8:30. The indicator posted a reading of 1.6B in March, slightly above the market forecast of 1.5B. The markets are predicting a slight improvement, with a rise to 1.7B.
- Nationwide HPI: Thursday, 6:00. This house indicator plunged last month, declining by 1.0%. This marked the lowest reading in over two years. The markets are calling for an improved reading of 0.6% in May.
- Services PMI: Thursday, 8:30. The index has been close to the 55.0 level for most of 2012, indicating growth in the servicess industry. No change is expected, as the May forecast is for 54.6.
*All times are GMT
GBP/USD Technical Analysis
GBP/USD opened the week at 1.6131. After dropping slightly to a low of 1.6076, the pair climbed as high as 1.6280, briefly breaching resistance at 1.6265 (discussed last week). The pair closed at 1.6249, as the pound continues to shine.
Technical levels from top to bottom
We begin with strong resistance at 1.6750, a line not tested since last August. Next, there is resistance at 1.6617. Below, there is resistance at 1.6474. After falling below this level last summer, GBP/USD went on a sharp spiral downwards, which lasted until October 2011.
Next, 1.6356, is providing the pair with strong resistance. If the spectacular rise by the pound continues, this line could be tested. This is followed by 1.6265, which was briefly breached this week by the pair, and now is a line of weak resistance.
The 1.6142 line now finds itself in a support role, after providing strong resistance since last October. This is followed by the psychologically important line of 1.60, where has been strengthening as GBP/USD trades at higher levels. Next, 1.5930, which earlier in April was a fluid line, is now providing strong support for the pair.
Below, there is support at 1.5805, which also saw a lot of movement in April. The final support level for now is 1.5750, which has provided the pair with support since mid-March.
I remain bullish on GBP/USD.
GBP/USD continued its upward move this week, and is now trading in the mid-1.62 level. What’s next for the pound? With some improved economic indicators in the UK and higher inflation, the central bank could soon discuss hiking interest rates rather than adding to QE, which would provide a boost the the pound.
Further reading:
- For a broad view of all the week’s major events worldwide, read the USD outlook.
- For EUR/USD, check out the Euro to Dollar forecast.
- For the Japanese yen, read the USD/JPY forecast.
- For the Australian dollar (Aussie), check out the AUD to USD forecast.
- For the New Zealand dollar (kiwi), read the NZD forecast.
- For USD/CAD (loonie), check out the Canadian dollar forecast.
- For the Swiss franc, see the USD/CHF forecast.
