GBP/USD showed some strong gains but was unable to consolidate and ended the week unchanged. The pair closed the week at 1.6829. The upcoming week has a very light schedule, with just three releases. Here is an outlook for the main events moving the pound, and an updated technical analysis for GBP/USD.
British Retail Sales improved sharply and GDP posted another strong gain, but the pound could not hold onto mid-week gains. In the US, the Federal Reserve minutes indicated that policymakers discussed QE exit strategies but didn’t reach any final decisions. Unemployment Claims missed expectations, while key housing data was mixed.
[do action=”autoupdate” tag=”GBPUSDUpdate”/]GBP/USD graph with support and resistance lines on it. Click to enlarge: 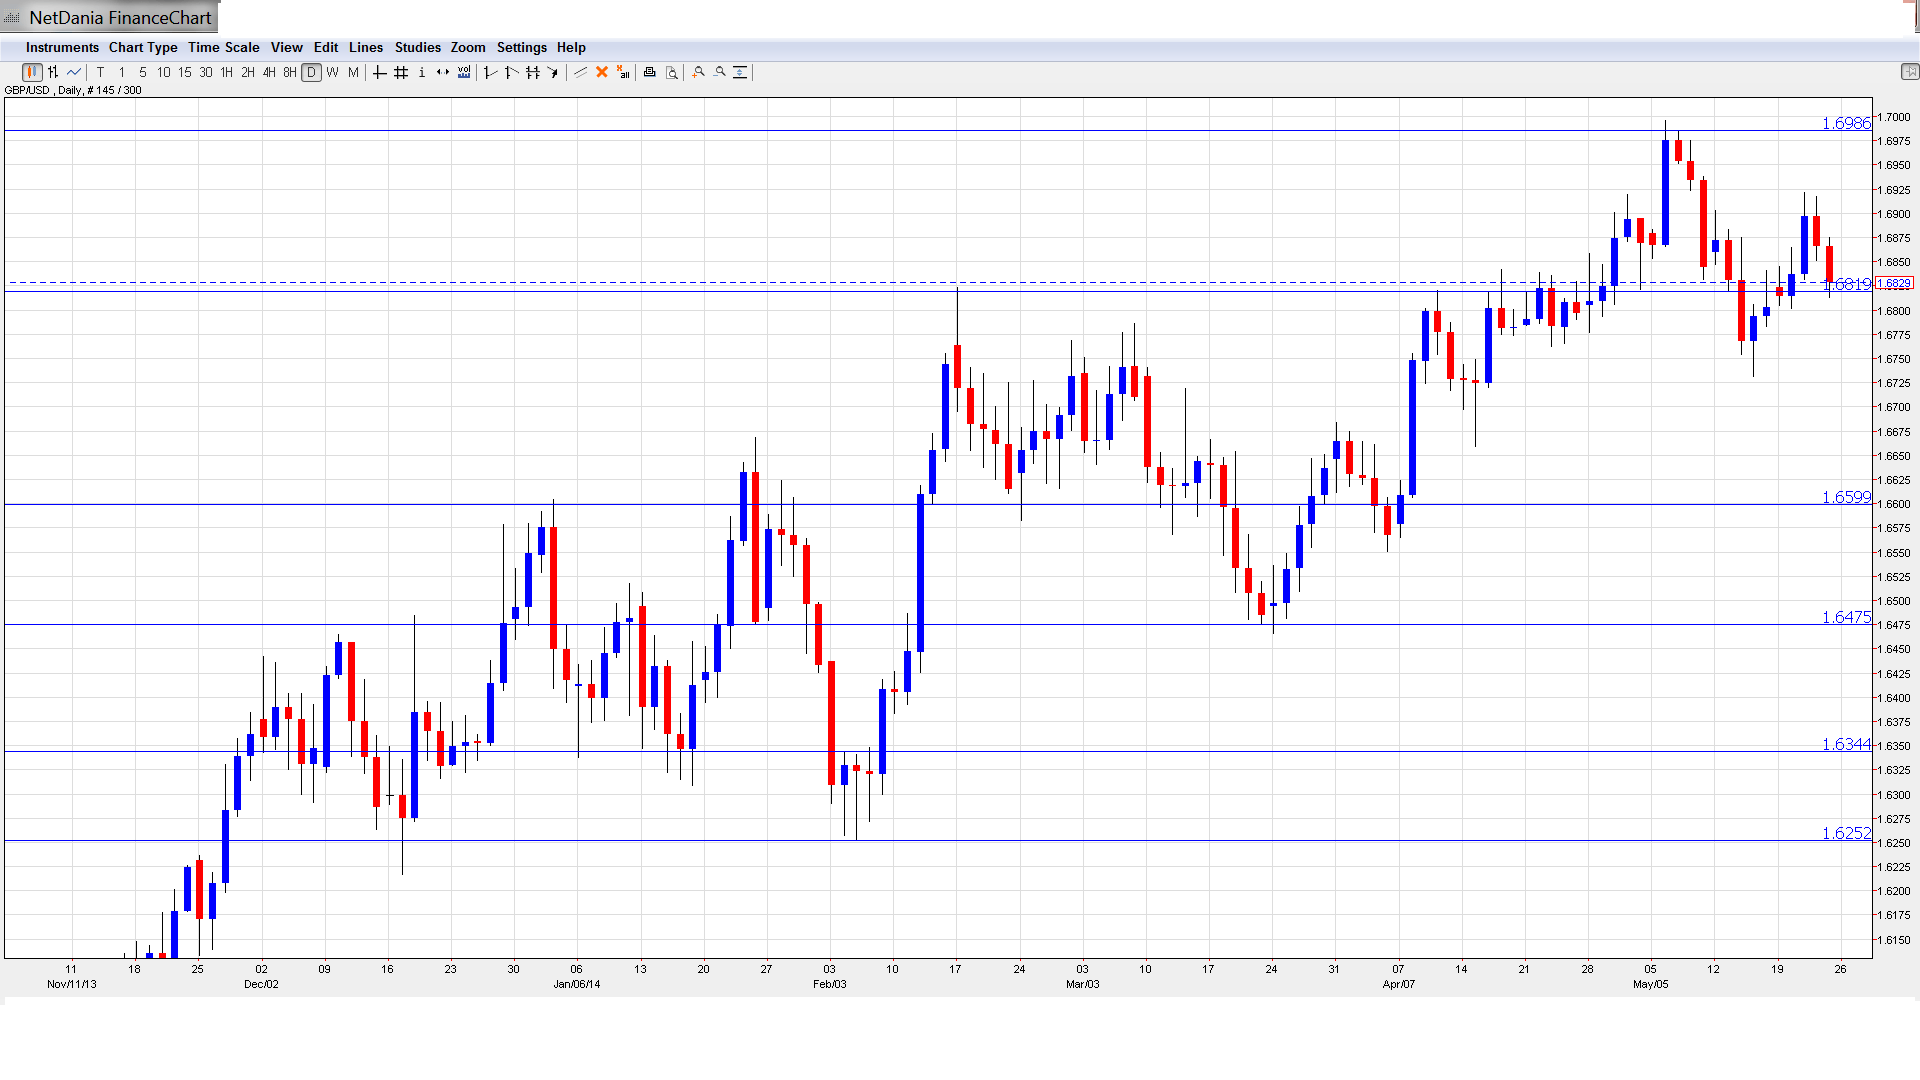
- BBA Mortgage Approvals: Tuesday, 8:30. BBA Mortgage Approvals is an important gauge of activity in the housing market as well as consumer confidence, as a home is likely the biggest purchase that a consumer will make. The indicator has been on a downturn, missing the estimates over the past two releases. The markets are expecting the downward trend to continue in the April release, with the estimate standing at 45.2 thousand.
- CBI Realized Sales: Wednesday, 10:00. This indicator has shown strong fluctuations, making accurate forecasts a tricky task. In March, the indicator shot up to 30 points, easily surpassing the estimate of 18 points. The markets are expecting another strong reading in April, with the estimate standing at 36 points.
- GfK Consumer Confidence: Tuesday, 23:05. Consumer Confidence has improved in 2014, but still remains above the zero level, indicative of consumer pessimism despite the improved economy. The estimate for April stands at -1 point.
* All times are GMT
GBP/USD Technical Analysis
GBP/USD opened the week at 1.6823 (which was a resistance line last week). The pair dipped to a low of 1.6802, then rebounded and hit a high of 1.6921. This was followed by a retraction, as the pair ended the week unchanged at 1.6829.
Live chart of GBP/USD:
[do action=”tradingviews” pair=”GBPUSD” interval=”60″/]
Technical lines from top to bottom
We start with resistance at 1.7375. This line marked the start of a sharp pound rally in March 2006, which saw the GBP/USD push above 2.11.
Next is 1.7180, which has served in a resistance since October 2008. This is followed by 1.6990, which is protecting the key psychological level of 1.70.
1.6823 continues to be busy in the month of May. The line was breached during the week and has switched to a weak support line. 1.6705 continues to provide strong support.
The round number of 1.6600 follows. It has remained intact since early April, when the pound started its current rally. 1.6475 is the next support level.
1.6343 saw some activity in early February but has provided strong support since that time.
The final support line for now is 1.6247.
I am neutral on GBP/USD.
The pound continues to trade at high levels against the dollar, and came very close to the 1.70 barrier earlier in May. Although the BOE has tried to dampen enthusiasm about a rate hike, the markets continue to speculate about an increase, as the employment picture continues to brighten. In the US, market sentiment remains positive, as economic releases have generally been strong, and the Fed tapers are likely to continue.
Further reading:
- For a broad view of all the week’s major events worldwide, read the USD outlook.
- For EUR/USD, check out the Euro to Dollar forecast.
- For the Japanese yen, read the USD/JPY forecast.
- For the Australian dollar (Aussie), check out the AUD to USD forecast.
