Gold & Silver futures continue to move along their gradual declines supported by an improved economic outlook in the US and a bullish Dollar Index.
Both the metals however seem to be looking for potential pullbacks to the declines with an eye for testing the previously breached support levels. Key risks to the metals come from the US GDP q/q revision this week followed by next week’s US NFP data.
Gold Futures – Technical Update
Gold Futures closed 0.69% higher with geo-political events driving the bulls. The US and its coalition partners had, earlier in the week launched an attack on the ISIS in the Middle East. Gold gains were further supported by mixed economic fundamentals from the US.
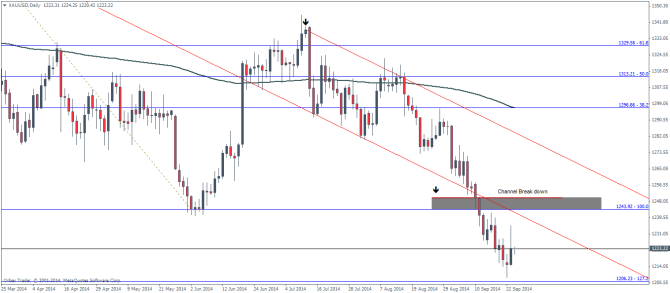
On the daily charts for Gold, we see that Monday’s candlestick closed as a spinning top/doji candlestick pattern followed by a higher close yesterday at 1223.41. Although the overall larger trend of Gold continues to be looking to the downside, the short term price action looks poised for a corrective rally.
The Gold line chart below shows the Fibonacci levels plotted where we noticed a nice and clean pullback to the 61.8% level. Price eventually dropped further and currently looks to be in a corrective phase with the probably immediate pullbacks likely to close near $1243 region after reversing near the monthly support level 3 of 1216.15. The price action after the main pullback also seems to have respected the down trend channel line after breaking below the support level recently. The confluence of the channel and the Fibs pits Gold’s pullbacks to likely stall towards $1243 before we can see further downside moves.
Failure to contain the rally at $1243 could see price head back into the channel with the next technical resistance coming in at 1280 – 1276 (this month’s Support level 2).
Gold Pivot Levels
| R3 | R2 | R1 | Pivot | S1 | S2 | S3 | |
| Daily | 1255.43 | 1245.37 | 1234.43 | 1224.4 | 1213.24 | 1203.17 | 1192.21 |
| Weekly | 1263.4 | 1252.6 | 1235.16 | 1224.54 | 1206.87 | 1196.2 | 1178.64 |
| Monthly | 1365.04 | 1343.86 | 1315.39 | 1294.37 | 1265.83 | 1244.5 | 1216.15 |
Silver Futures – Technical Update
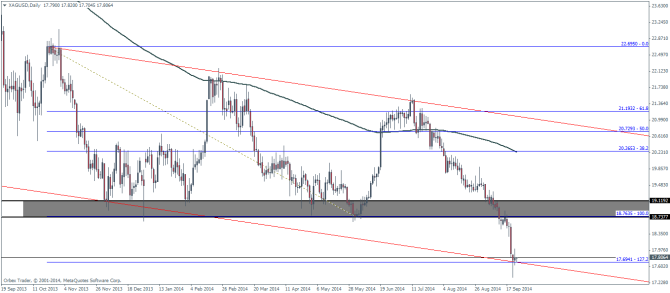
Silver continues to follow the path of Gold with continued declines, trading comfortably below its 200 day exponential moving average. Plotting a large channel on the daily charts shows Silver currently testing the lower channel support line. Incidentally, this also happens to be the monthly support level 3.
Technical resistance comes in between the region of $19 – $18 which should ideally cap any potential upside moves. Historically, the level between 18 & 19 has been a well respected support and resistance level, making this an important price point to keep an eye on.
Similar to Gold’s analysis, Silver has also respected the Fib levels with a clean reversal near the 61.8% Fib level of $21.2. Price subsequently dropped to test the 127.2% Fib level at $17.7. From the charts, we can expect to see a corrective rally back towards $18.76 which now shows a confluence of previous channel support level, a technically sound support level as well as the 100% Fib level.
Silver Pivot Levels
| R3 | R2 | R1 | Pivot | S1 | S2 | S3 | |
| Daily | 18.36 | 18.18 | 17.99 | 17.81 | 17.62 | 17.44 | 17.25 |
| Weekly | 19.67 | 19.28 | 18.59 | 18.19 | 17.5 | 17.1 | 16.41 |
| Monthly | 21.48 | 21.01 | 20.25 | 19.78 | 19.02 | 18.55 | 17.78 |
