Gold futures flirted yet again with the lows of 1185 levels making an intra-day dip to find support, pushing Gold futures higher. The decline below 1200 was on account of a better than expected labor market data for the month of September, released last week.
This level of 1185 has been a region of strong demand, with previous attempts proving hard to break below this support zone. The third attempt at this level makes it a triple bottom, with the question on everyone’s mind is whether Gold can rally higher after successfully testing the support zone.
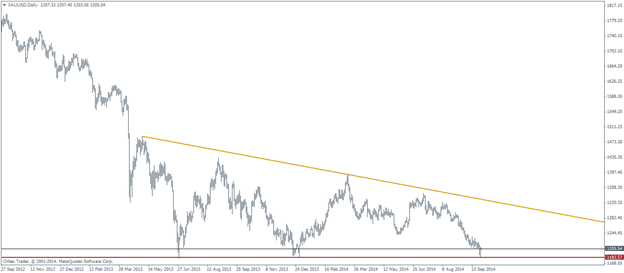
Within the larger scope of things, Gold has been making lower highs after bouncing off the support level, leaving a descending triangle formation taking shape since mid 2013. A break of the falling resistance line could see Gold futures rally higher while a fourth attempt to break the support could pave way for further declines as shown in the daily Gold chart below.
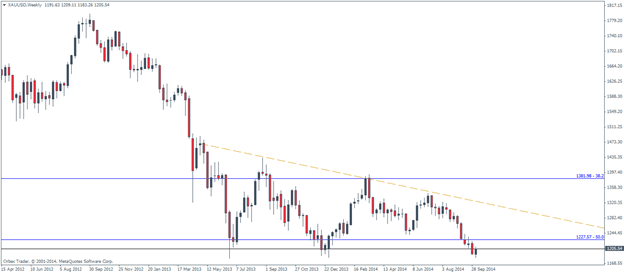
From the weekly charts it is easier to understand why this level of 1185 region is so strong, as it coincides with the 50% Fib level from the weekly charts. We also notice that the next level of likely support could come in at 1072/75 should the support at 1185 give way. Upon a closer look, we can notice that the main support lies at 1227.57, which managed to give way. The current short term rally that we see is likely to stall near this region for paving way for declines.
Continued bullish rally in the Greenback as well as improving economic data is likely to steer Gold to new lows. The most important event will be this month’s FOMC meeting where the Federal Reserve is expected to finally put an end to its QE3 program. It will only be a matter of time before the Fed starts to talk about interest rate hike in future upcoming meetings. Speculation is still rife as to when the Fed is likely to start increasing interest rates, with most analysts expecting a June 2015 rate hike.
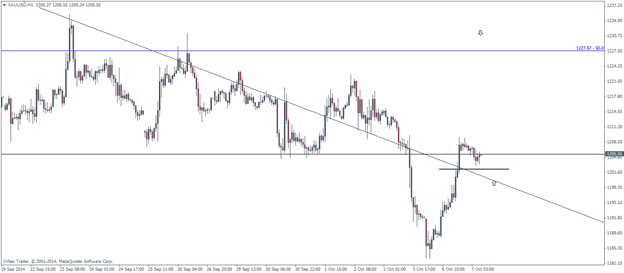
From an intra-day perspective, we see that on the H1 charts, Gold managed to break the falling trend line and looks to be currently testing the break out level with the intended objective of a possible rally towards 1227. At the time of writing, price action in Gold is potentially forming a bullish flag pattern as well, which could further validate this bias.
Last month, Gold futures dropped close to 6%, while the weakness in the US Dollar saw the bulls favoring to pick up Gold as previously established lows. Yesterday’s price action in Gold looks more likely to be a correction in the sell off and the overall bear trend. In this aspect, it would be a risky bet to look for buying Gold.
Gold – Monthly Pivot Levels
| R3 | R2 | R1 | Pivot | S1 | S2 | S3 |
| 1349.38 | 1319.69 | 1263.96 | 1234.27 | 1178.54 | 1148.85 | 1093.12 |
