- IOT/USD breaks out on the chart term chart.
- Long term descending trendline still holds key.
IOTA prices have just given a breakout on the immediate charts which may result in the crypto heading higher from current levels, but this rally may not last too long given that there’s another strong resistance on the long term chart.
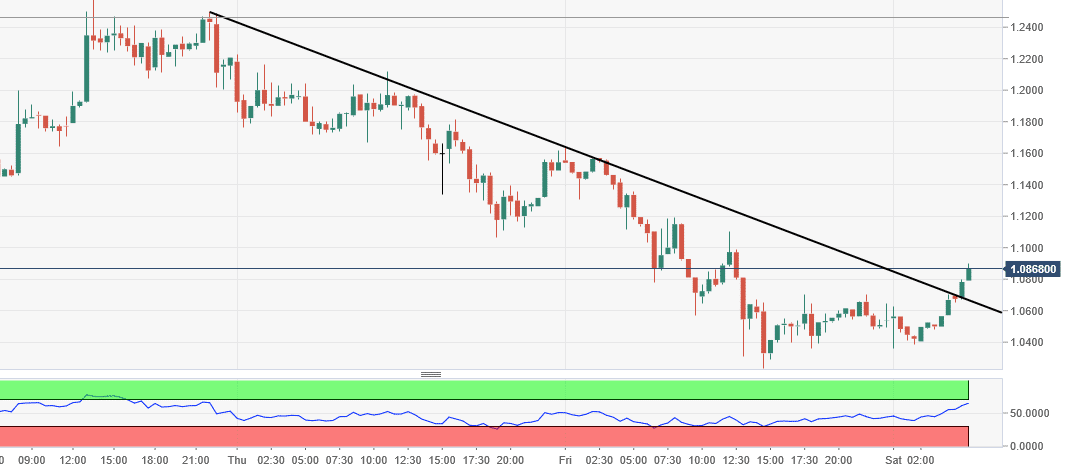
IOT/USD is up more than 3 percent on day at $1.08, up sharply from day’s low of $1.03. On the 30-minute chart, IOT has given a breakout from a descending trendline which could easily take it towards $1.16.
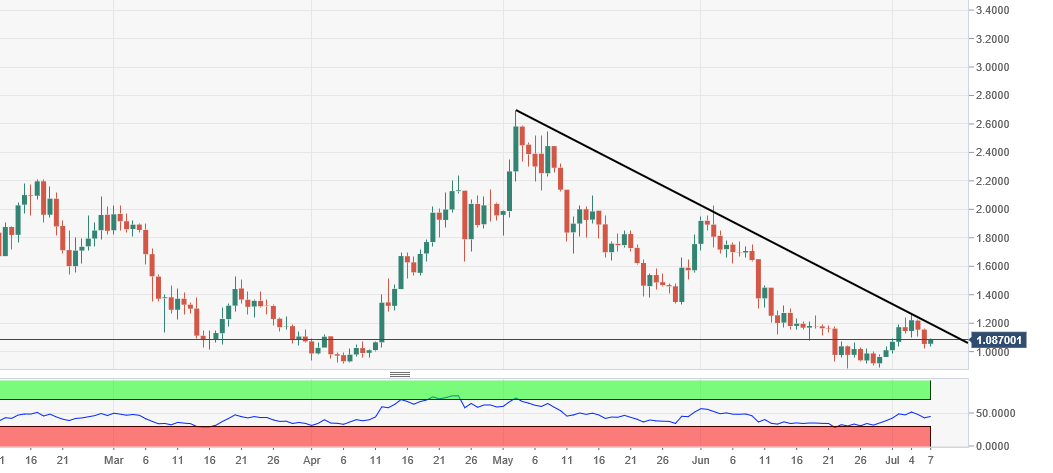
On the daily chart though, $1.16-$1.19 is exactly where there’s a resistance in the form of desending trendline which would take some time to break.
IOT/USD 30-minute chart:
IOT/USD daily chart: