Home Ltecoin (LTC/USD) Technical Analysis: 60-minute chart view remains bearish
Crypto News

Ltecoin (LTC/USD) Technical Analysis: 60-minute chart view remains bearish

  • Litecoin price swimming in the red on Thursday, down over 2.50% in the session.
  • LTC/USD heading fast towards a key area of support, which could be game-changing.  
  • 60-minute chart view is pointing to further downside, after ascending trend line is breached.  


LTC/USD 60-minute  chart  
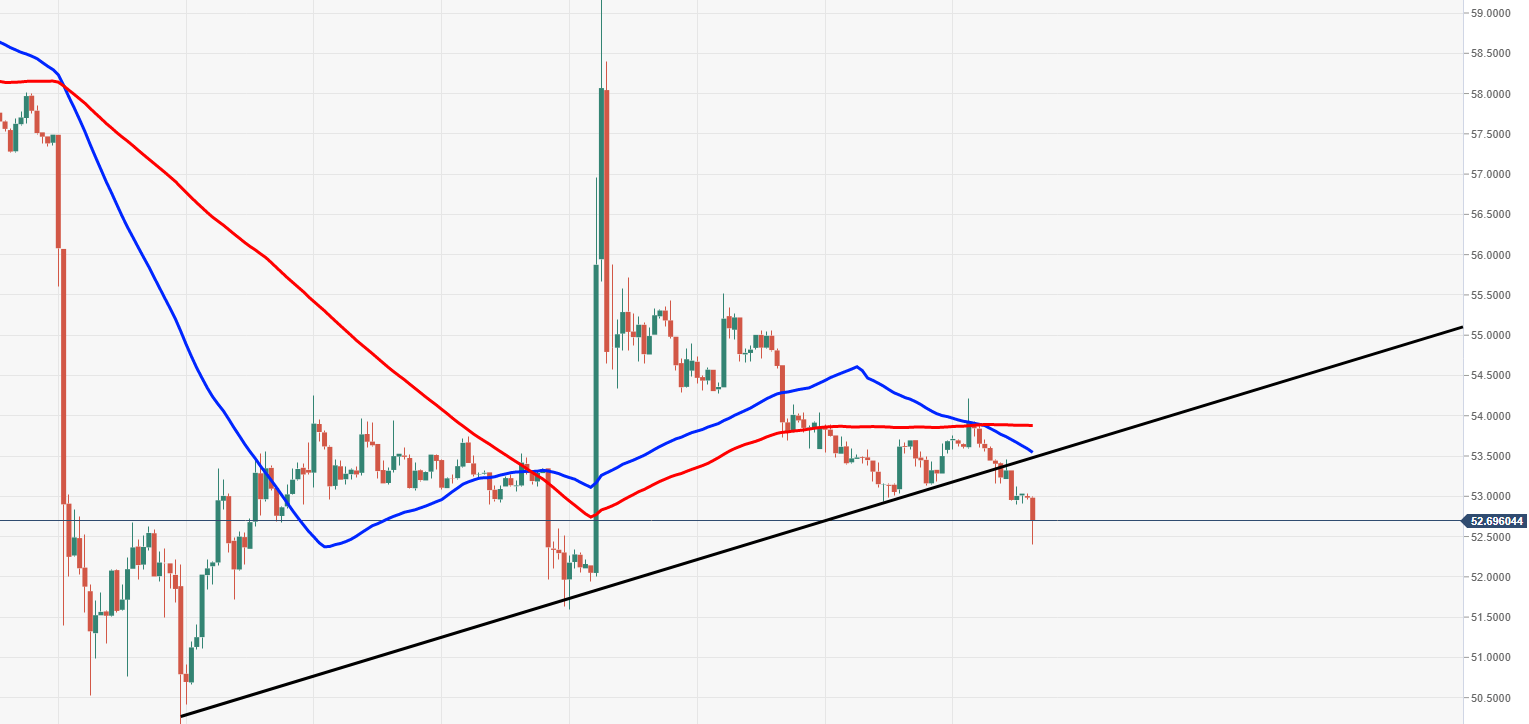


Spot rate:                   52.640

Relative change:       -2.55%

High:                          54.215

Low:                           52.402


Trend:                        Bearish


Support 1:                 51.900, low area 15 October.

Support  2:                 50.220, 11 October low.  

Support  3:                 47.210, demand zone. .  

Resistance  1:            53.480, underneath broken trend line & 50MA.  

Resistance  2:            53.872, 100MA.

Resistance  3:            54.222, resistance on 60-minute chart.

FX Street

FX Street

FXStreet is the leading independent portal dedicated to the Foreign Exchange (Forex) market. It was launched in 2000 and the portal has always been proud of their unyielding commitment to provide objective and unbiased information, to enable their users to take better and more confident decisions.