The New Zealand dollar continued struggling and dipped below 0.84. The calendar builds up with trade balance and the ANZ Business Confidence grabbing the attention. Here is an analysis of fundamentals and an updated technical analysis for NZD/USD.
More weakness in milk prices was joined by a surprising drop in quarterly producer prices, by 1%. Also inflation expectations remain modest, with a slide to 2.2%. In the US, strong housing data pushed the dollar initially higher, and the move intensified with the not-dovish FOMC minutes. Yellen’s Jackson Hole speech did not offer anything new, and left the previous trends in tact.
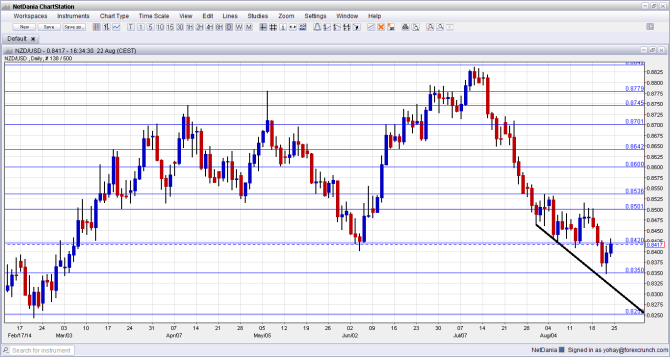
[do action=”autoupdate” tag=”NZDUSDUpdate”/]NZD/USD daily chart with support and resistance lines on it. Click to enlarge:
- Trade Balance: Monday, 22:45. While New Zealand continues enjoying surpluses, these have been squeezing in the past 4 months. From 247 million seen in June, another squeeze is expected. A deficit would certainly weigh on the kiwi and that is what is expected: -475 million.
- FPI: Tuesday, 22:45. As an exporter of food and especially milk, the Food Price Index is significant. After a rise of 1.4% in June, a reversal is expected in July.
- Building Consents: Thursday, 22:45. This monthly indicator of approvals for new households tends to be a volatile, yet influential measure of the housing sector. After a rise of 3.5% in July, consents are likely to show that housing is coming off the boil.
- ANZ Business Confidence: Friday, 1:00. After reaching a multi-decade high of over 70 points back in February, business confidence has been all downhill and reached 39.7 points in July. Another slide is likely, but the number will probably remain above 0, indicating continued optimism.
* All times are GMT.
NZD/USD Technical Analysis
Kiwi/dollar slipped under the 0.8420 line and the road was quick to lose also the round number of 0.84. While it managed to recover some of the falls, the pair remained weak.
Live chart of NZD/USD:
[do action=”tradingviews” pair=”NZDUSD” interval=”60″/]Technical lines, from top to bottom:
The round number of 0.87 proved its strength during May and is now a pivotal line. The older swing high of 0.8640 worked as a pivotal line but eventually capped the pair.
It is followed by the round number of 0.86, which worked as a cushion during May 2014. The 0.8535 capped the pair in early August 2014 and serves as minor resistance.
The round number of 0.85 returns to the chart and now defines the top of the range. 0.8420 is the low seen in August 2014 and significant support at the bottom of the same range.
It is followed by 0.8350, which was the low recorded during August. The last line for now is 0.8250, which provided some support back in February.
Further below, the round levels of 0.82 and 0.81 provide support.
Downtrend support
As the black line shows, the pair is trading alongside downtrend support since the end of July.
I am bearish on NZD/USD
There are too many negative signs from New Zealand. While the economy is still strong, the direction doesn’t look that promising. In addition, the recent strength from the United States could lead to more gains for the greenback.
Further reading:
- For a broad view of all the week’s major events worldwide, read the USD outlook.
- For EUR/USD, check out the Euro to Dollar forecast.
- For the Japanese yen, read the USD/JPY forecast.
- For GBP/USD (cable), look into the British Pound forecast.
- For the Australian dollar (Aussie), check out the AUD to USD forecast.
- For USD/CAD (loonie), check out the Canadian dollar forecast.
