USD/CAD was unchanged at the end of the week, closing at 1.0732. The upcoming week is very quiet, with just two events. Here is an outlook on the major events and an updated technical analysis for USD/CAD.
As expected, the BOC left interest rates at 1.0%. Inflation numbers matched expectations, while Manufacturing Sales and Wholesale Sales both posted strong gains. In the US, Janet Yellen testified on Capitol Hill, hinting that a rate hike could come earlier if inflation and employment numbers improve faster than expected. US housing and consumer confidence numbers were weak, while Unemployment Claims impressed.
[do action=”autoupdate” tag=”USDCADUpdate”/] USD/CAD daily chart with support and resistance lines on it.Click to enlarge: 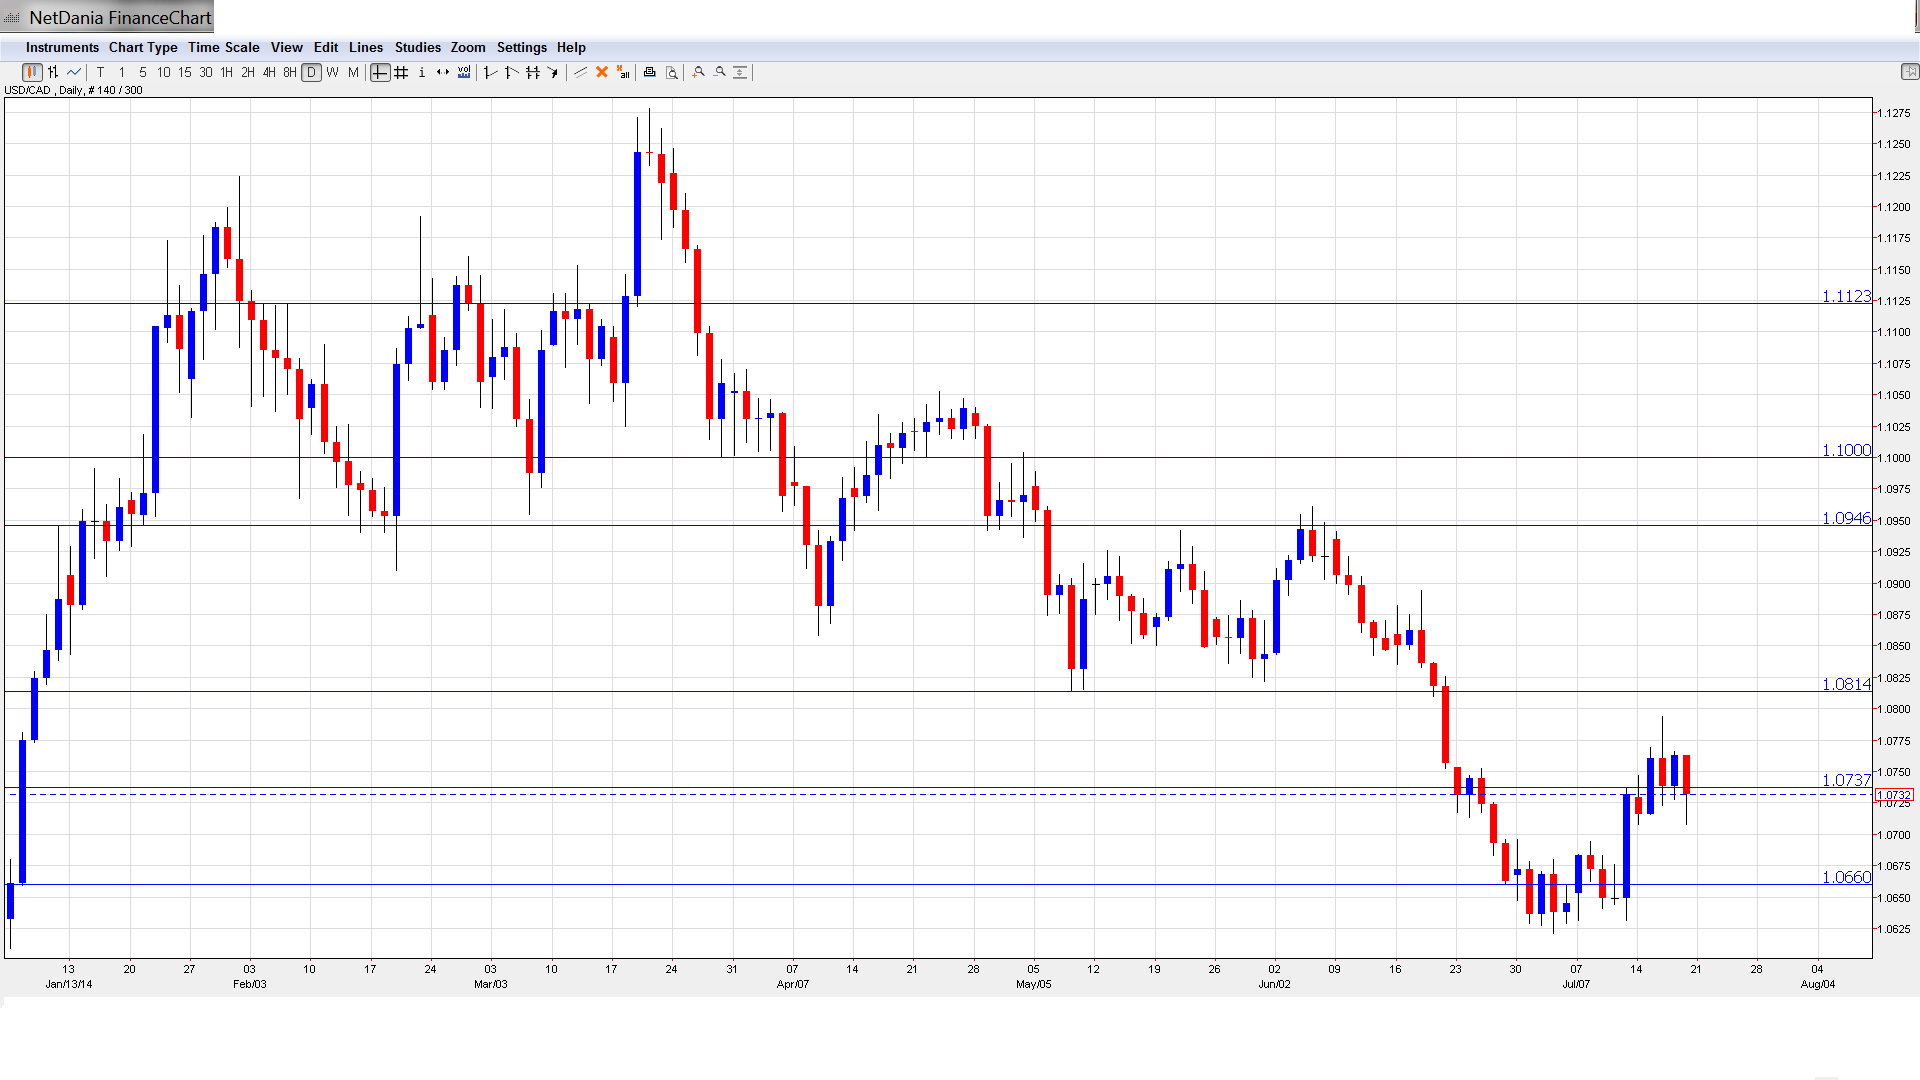
- Core Retail Sales: Wednesday, 12:30. This key event excludes volatile items such as automobile sales. The indicator posted a respectable gain of 0.7%, its best showing since August. This beat the estimate of 0.4%. The markets are expecting a weaker gain in June, with the estimate standing at 0.3%.
- Retail Sales: Wednesday, 12:30. Retail Sales is the primary gauge of consumer spending. The indicator rebounded last month with a strong gain if 1.1%, crushing the estimate of 0.4%. The markets are braced for a smaller gain in June, with an estimate of 0.6%.
* All times are GMT.
USD/CAD Technical Analysis
USD/CAD opened the week at 1.0729 and touched a high of 1.0794, as resistance at 1.0815 (discussed last week) remained firm. The pair then reversed directions, dropping to 1.0708. USD/CAD closed the week at 1.0732.
Live chart of USD/CAD: [do action=”tradingviews” pair=”USDCAD” interval=”60″/]
Technical lines, from top to bottom:
We begin with resistance at 1.1369. This level was breached in October 2008 as the US dollar posted sharp gains, climbing as high as the 1.21 level. This line has remained steady since July 2009.
1.1124 remains a strong resistance line. It has held firm since late March.
The psychological barrier of 1.10 has provided resistance since May, and has some breathing room with the Canadian dollar trading at higher levels. This is followed by resistance at 1.0945.
1.0815 continues to provide resistance, but faced strong pressure mid-week as the US dollar showed some strength. The line has remained intact since mid-June.
The pair briefly broke through resistance at 1.0737, but the line recovered and is a weak resistance line. This line was a cap in mid-2010, before the US dollar tumbled and dropped all the way into 0.93 territory. Look for this line to see activity early in the week.
1.0660 held steady as a support level. It is not a strong line, and could face pressure if the Canadian dollar can muster some strength.
1.0526 has been a strong support line since late November. 1.0422 was a key support line in mid-November.
1.0271 is the next support line. This line marked the start of a rally by the pair last October, which saw the US dollar climb above the 1.12 line.
1.0182 is the final support level for now. This line has held steady since September.
I am bullish on USD/CAD
US employment numbers continue to impress and the markets will be looking for a rate hike sometime after QE winds up, which will likely be in October, if there are no negative surprises from the US economy. The Canadian economy has not been able to keep pace with its southern neighbor, so the loonie will be hard pressed to hold its own against the greenback.
Further reading:
- For a broad view of all the week’s major events worldwide, read the USD outlook.
- For EUR/USD, check out the Euro to Dollar forecast.
- For the Japanese yen, read the USD/JPY forecast.
- For GBP/USD (cable), look into the British Pound forecast.
- For the Australian dollar (Aussie), check out the AUD to USD forecast.
- USD/CAD (loonie), check out the Canadian dollar.
