The Canadian dollar sagged on Friday, as USD/CAD pushed above the 1.08 level, closing at 1.0803. On the release front, it’s another quiet week, with only two events. Here is an outlook on the major events and an updated technical analysis for USD/CAD.
Canadian retail sales were a mixed bag and had little effect on the pair. In the US, it was an excellent week as housing and employment numbers sparkled. On Friday, US Durable Goods data was unexpectedly strong, and the US dollar took advantage, posting gains against the loonie and pushing above the 1.08 line.
[do action=”autoupdate” tag=”USDCADUpdate”/] USD/CAD daily chart with support and resistance lines on it.Click to enlarge: 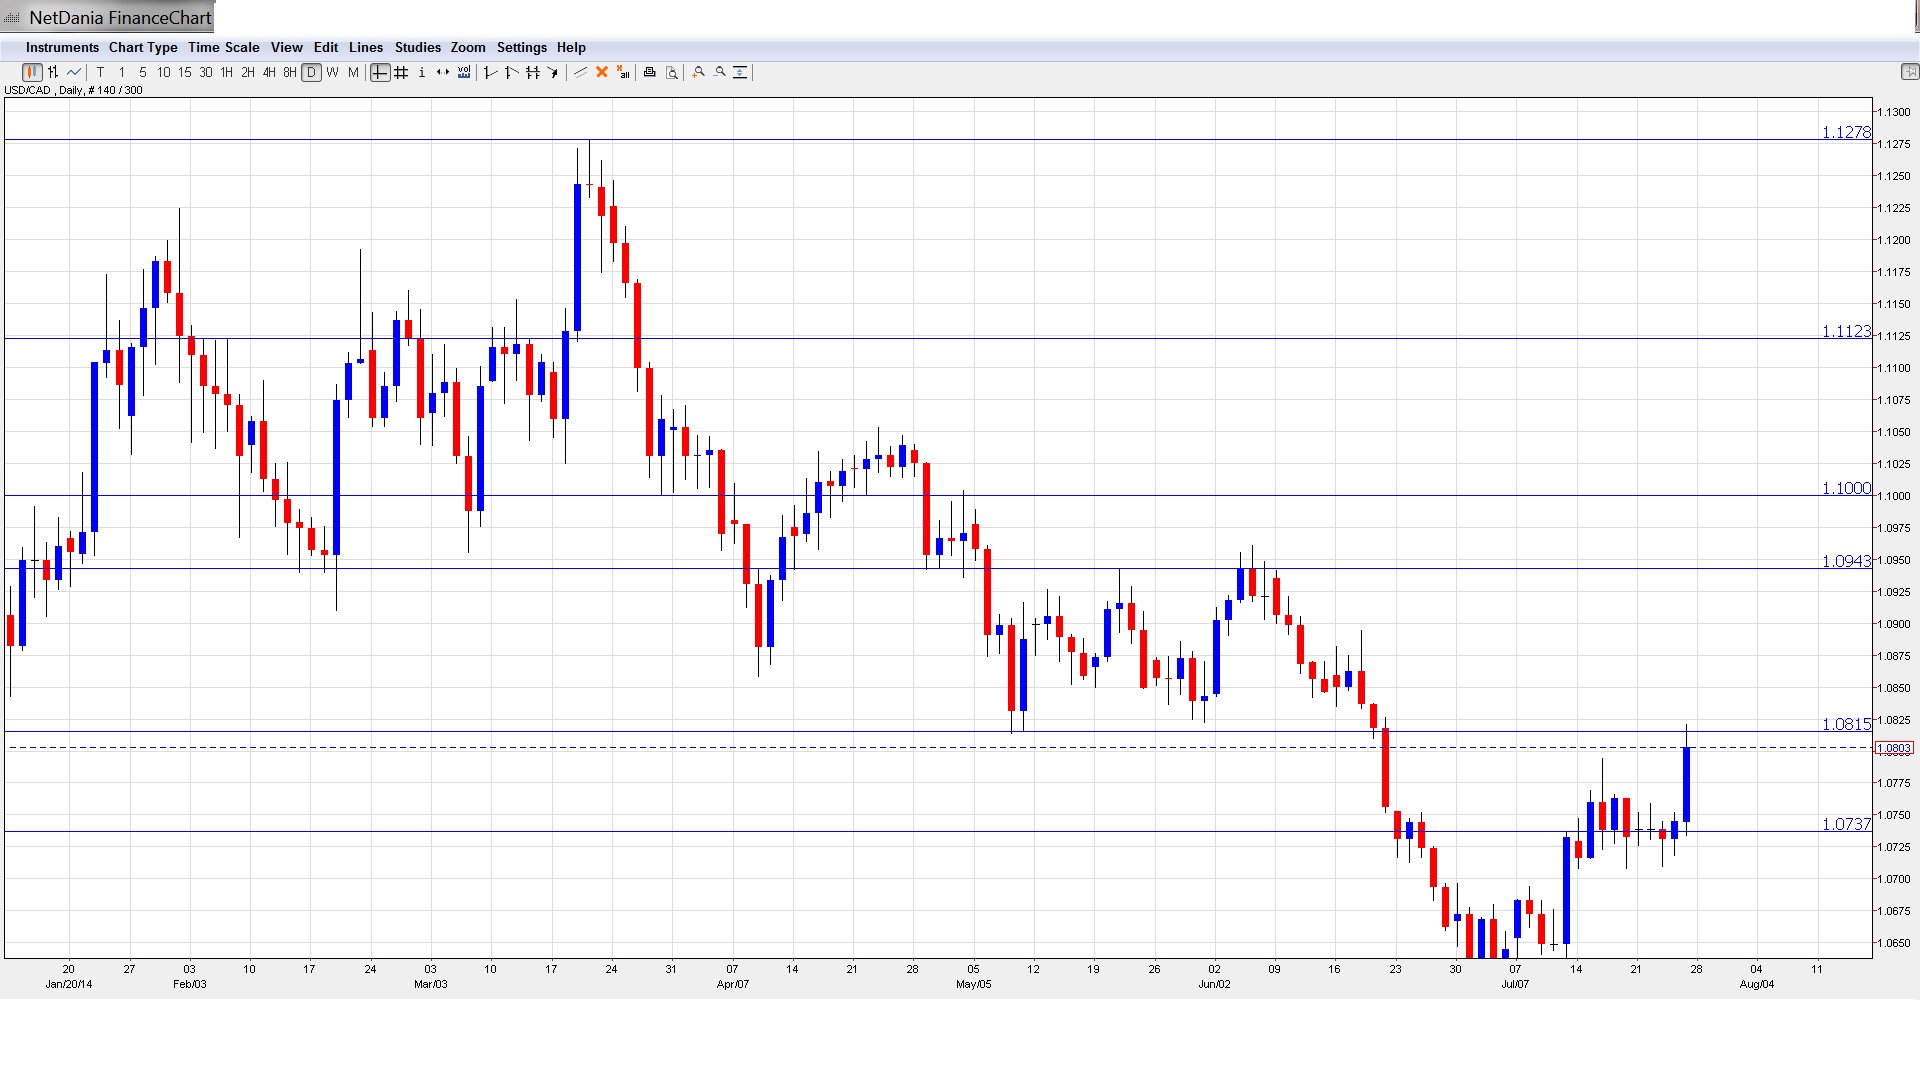
- RMPI: Wednesday, 12:30. Raw Materials Price Index is an important gauge of inflation in the manufacturing sector. The index disappointed last month with its first decline in 2014, coming in at -0.4%. This was nowhere near the estimate of +1.3%. The markets are expecting a strong turnaround in June, with an estimate of 0.6%.
- GDP: Thursday, 12:30. GDP is the primary gauge of the health and economy, and should be treated as a market-mover by traders. Unlike most other developed countries, Canada releases GDP on a monthly basis, rather than every quarter. The index has been steady but weak, with two straight readings of 0.1%. The forecast for the upcoming release stands at 0.3%.
* All times are GMT.
USD/CAD Technical Analysis
USD/CAD opened the week at 1.0739 and dropped to a low of 1.0710. The pair then reversed directions, pushing above the 1.08 line for the first time since late June. The pair touched a high of 1.0821, breaking above resistance at 1.0815 (discussed last week). USD/CAD closed the week at 1.0803.
Live chart of USD/CAD: [do action=”tradingviews” pair=”USDCAD” interval=”60″/]
Technical lines, from top to bottom:
We start with resistance at 1.1369. This level was breached in October 2008 as the US dollar posted sharp gains, climbing as high as the 1.21 level. This line has remained steady since July 2009.
1.1278 has provided resistance since March. This line marked the start of a rally by the Canadian dollar, which dropped below the 1.09 level.
1.1124 remains a strong resistance line.
The psychological barrier of 1.10 has provided resistance since May. This is followed by resistance at 1.0945.
1.0815 was breached for the first time since June, but recovered. It is currently a weak resistance line and could see further action early in the week.
1.0737 was easily breached by the pair and has reverted to support role. This line was a cap in mid-2010, before the US dollar tumbled and dropped all the way into 0.93 territory.
1.0660 has strengthened in support as the pair trades at higher levels.
1.0526 has been a strong support line since late November. 1.0422 was a key support line in mid-November.
1.0271 is the final support level for now. This line marked the start of a rally by the pair last October, which saw the US dollar climb above the 1.12 line.
I am bullish on USD/CAD
US numbers continue to point in the right direction, led by the all-important employment indicators. Although inflation remains weak, market sentiment is strong, and this has help the dollar post gains against its rivals. The Canadian economy has not been able to keep pace with its southern neighbor, and we could see the Canadian dollar continue to lose ground.
Further reading:
- For a broad view of all the week’s major events worldwide, read the USD outlook.
- For EUR/USD, check out the Euro to Dollar forecast.
- For the Japanese yen, read the USD/JPY forecast.
- For GBP/USD (cable), look into the British Pound forecast.
- For the Australian dollar (Aussie), check out the AUD to USD forecast.
- USD/CAD (loonie), check out the Canadian dollar.
