USD/CAD rebounded strongly last week, gaining close to 200 points. The pair closed the week just shy of the 1.22 line. This week’s major events are the overnight rate and GDP. Here is an outlook on the major market-movers and an updated technical analysis for USD/CAD.
The US continues to release lukewarm numbers, but the FOMC minutes were optimistic in tone, as policymakers remain confident that Q2 will outperform a disappointing Q1. This positive sentiment gave the US dollar a big boost against its Canadian counterpart. In Canada, key data met expectations.
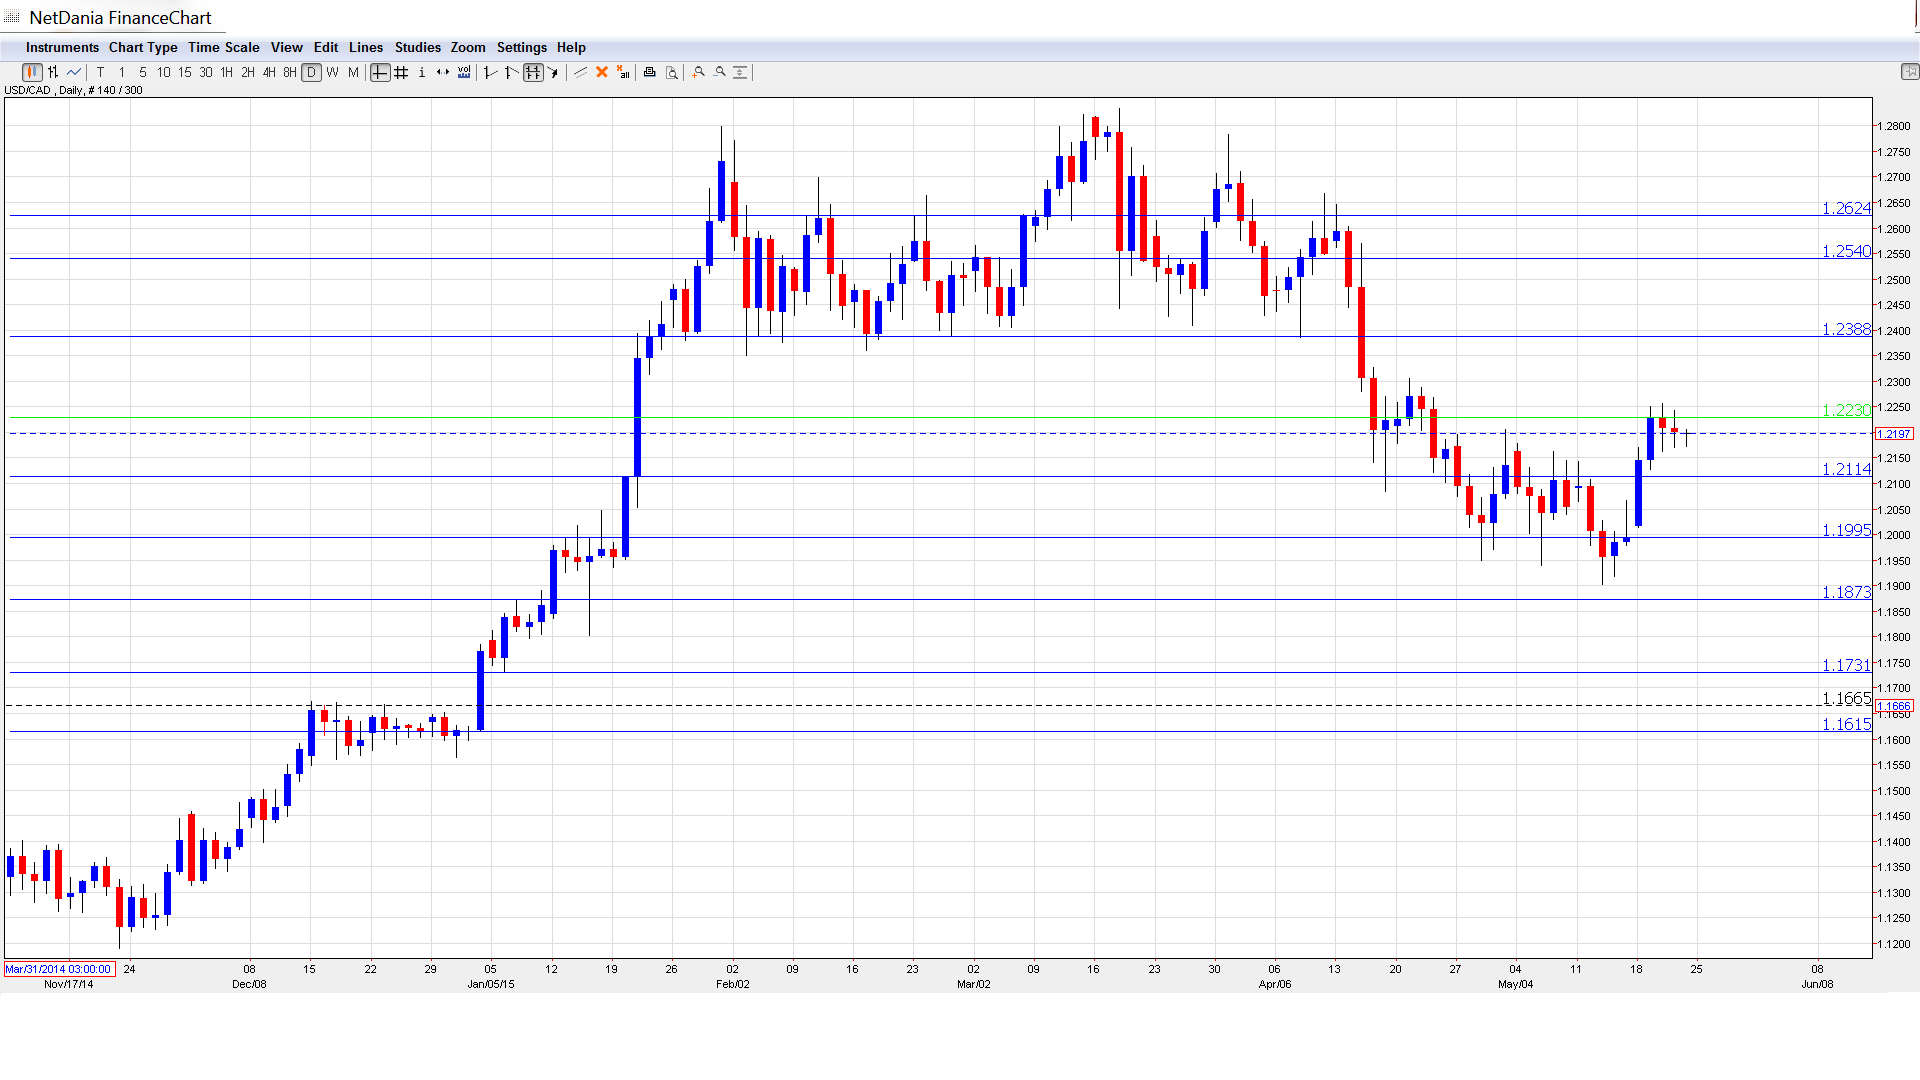
[do action=”autoupdate” tag=”USDCADUpdate”/]USD/CAD daily chart with support and resistance lines on it. Click to enlarge:

- BOC Overnight Rate: Wednesday, 14:00. The BOC surprised markets in January with an interest rate cut from 1.0% to 0.75%, but has kept the rates steady since then. No change is expected in the May rate statement.
- Current Account: Thursday, 12:30. Current Account is closely linked to currency demand, as foreigners need to purchase Canadian dollars in order to buy Canadian goods and other services. The current account debt swelled to C$13.9 billion in Q4, much higher than the forecast of C$-7.4 billion. The markets will be hoping for some improvement in the Q1 release.
- RMPI: Thursday, 12:30. This indicator measures inflation in the manufacturing sector. The index has been struggling, with only on gain to show in 2015. The March reading came in at -0.9%, better than the estimate of -1.8%. Will we see another decline in the April report?
- GDP: Friday, 12:30. GDP is one of the most important economic indicators, and an unexpected reading can have an immediate impact on the direction of USD/CAD. The indicator posted an unimpressive reading of 0.0% in February, and the markets will be hoping for a figure in positive territory in the March report.
- BOC Deputy Governor Lawrence Schembri Speaks: Saturday, 18:00. Schembri will deliver remarks at an event in Toronto. A speech which is more hawkish than expected is bullish for the Canadian dollar.
USD/CAD Technical Analysis
USD/CAD opened the week at 1.2015 and touched a low of 1.2013. It was all uphill from there, as the pair climbed to a high of 1.2256, testing resistance at 1.2230 (discussed last week). The pair closed the week at 1.2196.
Live chart of USD/CAD: [do action=”tradingviews” pair=”USDCAD” interval=”60″/]
Technical lines, from top to bottom
We begin with resistance at 1.2624.
1.2541 remains a strong resistance line. It has held firm since mid-April.
1.2387 is the next line of resistance.
1.2230 was tested as USD/CAD posted a sharp rally early in the week before retracting.
1.2114 is an immediate support level.
1.1995, just below the symbolic 1.20 level, has strengthened in support.
1.1872 is the next support level.
1.1731 has held firm since early January.
The final support line for now is 1.1615. This line marked the start of a rally by the US dollar at the start of the year.
I am bullish on USD/CAD
Despite US numbers which continue to disappoint, the US dollar had no trouble pounding the struggling Canadian dollar last week. If Canadian GDP continues to look sluggish, the greenback’s rally could continue.
In our latest podcast, we discuss commodity currencies, oil hedging and preview next week’s events.
Subscribe to Market Movers on iTunes
Further reading:
- For a broad view of all the week’s major events worldwide, read the USD outlook.
- For EUR/USD, check out the Euro to Dollar forecast.
- For the Japanese yen, read the USD/JPY forecast.
- For GBP/USD (cable), look into the British Pound forecast.
- For the Australian dollar (Aussie), check out the AUD to USD forecast.
- For the kiwi, see the NZDUSD forecast.
