The Canadian dollar posted modest gains last week, as USD/CAD closed the week at 1.1286. This week’s highlights are Wholesale Sales and Core CPI. Here is an outlook on the major market-movers and an updated technical analysis for USD/CAD.
US employment numbers were not impressive last week, as jobless claims missed expectations and JOLTS softened. Still, there was a silver lining as the number of quits is back to pre-crisis levels, which shows that people are confident to switch jobs. Confidence is also apparent in the highest consumer confidence since 2007 and an improvement in retail sales. The Canadian dollar got a boost as Manufacturing Sales posted a strong gain.
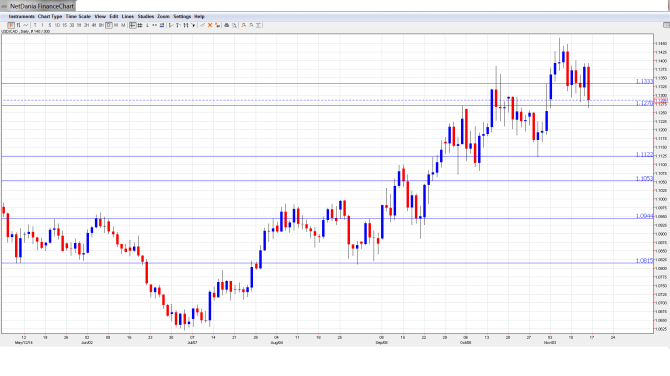
[do action=”autoupdate” tag=”USDCADUpdate”/]USD/CAD daily chart with support and resistance lines on it. Click to enlarge:
- Foreign Securities Purchases: Monday, 13:30. The indicator improved to CAD $10.28B for September, well above the estimate of CAD $4.31 billion. The markets are expecting the indicator to continue to move upwards, with a forecast of CAD $11.32B.
- BoC Deputy Governor Agathe Cote Speaks: Tuesday, 19:05. Cote will speak at an event in Calgary, Alberta. A speech which is more hawkish than expected is bullish for the Canadian dollar.
- Wholesale Sales: Thursday, 13:30. Wholesale Sales improved in September to 0.2%, up from -0.3% in the previous release. The markets are expecting a strong October reading, with an estimate of 0.7%.
- Core CPI: Friday, 13:30. Core CPI excludes the most volatile items which make up CPI, making Core CPI a more accurate indicator. The index slipped to 0.2% in October, down from 0.5% a month earlier. No change is expected in the upcoming release.
- CPI: Friday, 13:30. CPI is the primary gauge of consumer inflation. The index has not looked strong in recent releases, and posted a weak gain of 0.1% in October. The markets are braced for a decline in the upcoming release, with an estimate of -0.3%.
* All times are GMT.
USD/CAD Technical Analysis
USD/CAD opened the week at 1.1329 and quickly climbed to a high of 1.1401. The pair then reversed directions and fell to a low of 1.1263, breaking below support at 1.1271 (discussed last week). USD/CAD closed the week at 1.1286.
Live chart of USD/CAD: [do action=”tradingviews” pair=”USDCAD” interval=”60″/]
Technical lines, from top to bottom:
We start with resistance at 117.52. This lined marked the start of a rally by the Canadian dollar in February 2007, which saw USD/CAD drop below parity. 1.1640 is next.
1.1494 had no trouble this week. This line was a key resistance line in November 2006.
1.1333 was tested by the pair for a second straight week. It is an immediate resistance line and could see action early in the week.
1.1271 is a weak support line. It was tested during the week.
1.1122 marks the low point of a US dollar rally which started late in October and saw USD/CAD climb above 1.14 last week.
1.1054 remains a strong support line. 1.0944 is next.
1.0815 has held firm since late August. It is the final support line for now.
I am neutral on USD/CAD
US numbers remain strong, led by solid consumer spending and confidence numbers. A stronger US economy is good news for Canada,which relies heavily on its southern neighbor. As well, recent Canadian numbers have looked solid, led by impressive employment numbers.
In our latest podcast, we dive into Australia, analyze the US jobs picture, talk about the punished pound and discuss the collapsing yen:
