USD/CAD had difficulty finding its feet last week, and ended the week with modest gains. The pair closed the week at 1.3280. There are only 4 events this week, highlighted by Building Permits. Here is an outlook on the major market-movers and an updated technical analysis for USD/CAD.
The Canadian dollar suffered when oil prices fell but could not really rise when they rose. It seems that the market wants to sell Canadian dollars even in the face of upbeat employment figures. In the US, employment numbers were mixed, which only complicates things for the Fed, as it mulls over a rate hike.
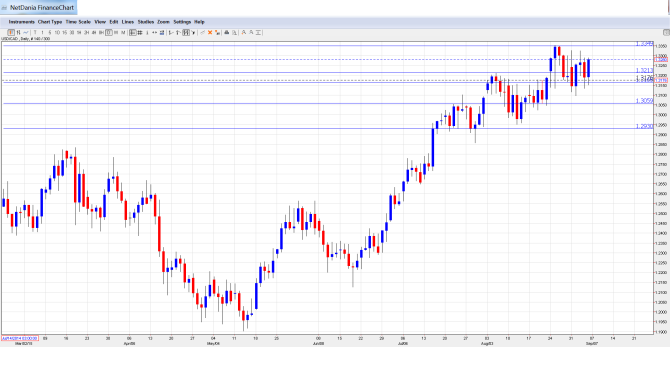
[do action=”autoupdate” tag=”USDCADUpdate”/]USD/CAD daily chart with support and resistance lines on it.
- Housing Starts: Wednesday, 12:15. Housing Starts slipped below the 200 thousand level in July, for the first time in three months. The indicator fell to 193 thousand, well short of the estimate of 205 thousand. Little change is expected in the August report, with a forecast of 194 thousand.
- Building Permits: Wednesday, 12:30. Building Permits tends to show strong fluctuations, making accurate estimates a tricky task. The indicator surged 14.8% in June, crushing the estimate of 5.1%. Will the indicator repeat with another strong reading?
- Overnight Rate: Wednesday, 14:00. The BOC surprised the markets with a 1/4% cut in August to 0.50%. The benchmark rate is expected to remain at 0.50%, but the markets will be listening carefully to the BOC’s rate statement for clues about future interest rate moves.
- NHPI: Thursday, 12:30. This housing inflation index is an important gauge of the level of activity in the housing sector. The index edged up to 0.3% in June, which was within expectations. The estimate for the August report stands at 0.2%.
* All times are GMT.
USD/CAD Technical Analysis
USD/CAD opened the week at 1.3220 and quickly climbed to a high of 1.3353. The pair showed strong volatility early in the week, dropping to a low of 1.3097 as support held at 1.3063 (discussed last week). USD/CAD continued to show volatility closed the week at 1.3280.
Live chart of USD/CAD: [do action=”tradingviews” pair=”USDCAD” interval=”60″/]
Technical lines, from top to bottom
We begin with resistance at 1.3759.
1.3587 was a cap in March 2004.
1.3443 is the next line of resistance.
1.3346 has held firm since August 2004.
1.3213 was an important cap in early August.
1.3165 continues to be active. It is currently an immediate support line.
1.3063 is protecting the symbolic line of 1.30. It was tested as the Canadian dollar showed some strength during the week.
1.2930 has held firm since late July.
1.2798 is the final support line for now.
I am bullish on USD/CAD
The US economy continues to outperform its northern neighbor, and upcoming national elections in Canada means uncertainty which could hurt the Canadian dollar. Will the Fed press the rate trigger? In our opinion, there is a good chance of a “dovish rate hike”.
In our latest podcast we explain what’s going on with EUR and China before previewing the big events ahead:
Further reading:
- For a broad view of all the week’s major events worldwide, read the USD outlook.
- For EUR/USD, check out the Euro to Dollar forecast.
- For the Japanese yen, read the USD/JPY forecast.
- For GBP/USD (cable), look into the British Pound forecast.
- For the Australian dollar (Aussie), check out the AUD to USD forecast.
- For the kiwi, see the NZDUSD forecast.
