The Canadian dollar eventually kept its balance against the greenback, but traded quite choppily. The BOC Business Outlook Survey and Trade Balance are the main events this week. Here’s an outlook for the Canadian events and an updated technical analysis for the Canadian dollar.
The Canadian job market rebounded in February from its sluggish condition upon a remarkable addition of 82,300 jobs, most of them full time. This excellent reading came after a 2,800 drop in January causing unemployment to drop from 7.4% to 7.2%, more good news for the Canadian domestic economy. Will this trend continue?
Updates: USD/CAD remains close to parity, trading at 0.9984. Housing Starts will be published later in the week. After climbing above parity, USD/CAD is steady, trading at 1.0025. The markets are waiting for the release of Housing Starts later today. The forecast calls for a reading of 200K, virtually the same as last month. Housing starts posted a reading of 216K, the best performance in almost four years. USD/CAD continues to hug the parity level, trading at 0.9998. The markets are waiting for the release of the Trade Balance later today.
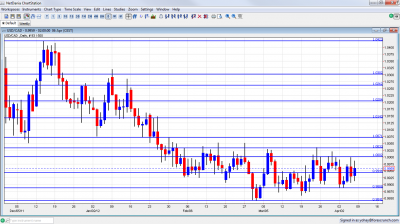
USD/CAD daily chart with support and resistance lines on it. Click to enlarge:
- BOC Business Outlook Survey: Monday, 14:30. The last Canadian businesses outlook signaled slower growth for2012 in light of the shakyU.S. recovery and debt crisis inEurope badly affecting the country’s business climate. 28% of companies surveyed confirmed tougher credit conditions compared with 23% claiming they had eased. The job market seemed more upbeat with 54% claiming they will hire in the next 12 months compared to 37% anticipating hiring will not change.
- Housing Starts: Wednesday, 12:15. Canadian housing starts increased in February by 201,000 from198,000 in the previous month amid an increase in multiple-unit buildings inQuebec indicating improved conditions in the housing market. A nother increase of 202,000 is anticipated
- Trade Balance: Thursday, 12:30.Canada’s trade surplus shrank to $2.1 billion in January amid depreciation in the value of exports from $2.9 billion the month before. Nevertheless this was the third consecutive monthly surplus indicating better conditions in the Canadian economy. Trade surplus is expected to rise reaching 2.2 billion
- NHPI : Thursday, 12:30. New house prices edged up 0.1% in January following a similar increase in December.Toronto andOshawa regions were the main contributors for this rise. Prices inVictoria, dropped 0.8% to encourage sales. A rise of 0.3% is anticipated this time.
* All times are GMT.
USD/CAD Technical Analysis
Dollar/CAD started the week with a small shake, before falling to 0.9888, a new line that didn’t appear last week. It the recovered and challenged the clear line of parity before more choppy trading that ended at 0.9959, close to last week’s close.
Technical lines, from top to bottom:
1.0423 is a stubborn line in the distance. It capped the pair at the end of 2011. The round number of 1.03 was the peak of a move upwards seen in November 2010 and has found new strength after working as a cap in January 2012.
1.0263 is the peak of surges during October, November and December, but was shattered after the move higher. It’s far at the moment. The round figure of 1.02 was a cushion when the pair dropped in November, and also the 2009 trough. It is weaker now but remains pivotal.
1.0143 was a swing low in September and worked as resistance several times afterwards. Closer to parity, 1.0070 provided support around the turn of the year, and is now closer.
1.0030 capped the pair twice in March 2012 and proved to be strong. The very round number of USD/CAD parity is a clear line of course, and was a line of battle that eventually saw the pair fall lower.
Under parity, we meet the pivotal line of 0.9950. It served as a top border to range trading in March 2012 and later as a line in the middle of the range. 0.9888 was a double bottom at the beginning of April 2012 and is a key line on the downside for now.
0.9870 was a trough reached once and challenged afterwards, and serves a bottom border of the range. 0.9830 provided support for the pair during September and is now stronger after a first attempt to breach it failed.
0.9840 served as a strong cushion at the end of February and the beginning of March 2012. 0.9780, where the current run began is the next and important support line.
It is closely followed by 0.9736, which provided support during August 2011. The veteran 0.9667 line worked as support at the beginning of 2011 and then for several months during the spring. It is a very clear and strong line on the chart.
0.9550 worked as support during April and also June and is minor now. 0.9406 was the trough in July 2011 and is the final frontier for now. Below this line, its back to 2007.
I remain neutral on USD/CAD.
Oil prices now turn against the loonie, as well as the weak Non-Farm Payrolls in the US, that trigger worries of soft demand. On the other side of the equation, impressing building permits calm the fear from a Canadian housing bubble, and also strong domestic job figures are certainly good news after many mediocre months.
Further reading:
- For a broad view of all the week’s major events worldwide, read the USD outlook.
- For EUR/USD, check out the Euro to Dollar forecast.
- For the Japanese yen, read the USD/JPY forecast.
- For GBP/USD (cable), look into the British Pound forecast.
- For the Australian dollar (Aussie), check out the AUD to USD forecast.
- For the New Zealand Dollar (kiwi), read the NZD forecast.
- For USD/CAD (loonie), check out the Canadian dollar forecast
- For the Swiss Franc, see the USD/CHF forecast
