The Canadian dollar posted gains for a second straight week, as USD/CAD ended the week below the 1.09 level, closing at 1.0887. This week has just four events, highlighted by Manufacturing Sales. Here is an outlook on the major events and an updated technical analysis for USD/CAD.
The Canadian dollar improved despite some disappointing numbers last week. Ivey PMI missed the estimate and Employment Change was major disappointment with a sharp drop. In the US, ISM Non-Manufacturing PMI beat the estimate and Unemployment Claims dipped to a three-week low.
[do action=”autoupdate” tag=”USDCADUpdate”/] USD/CAD daily chart with support and resistance lines on it.Click to enlarge: 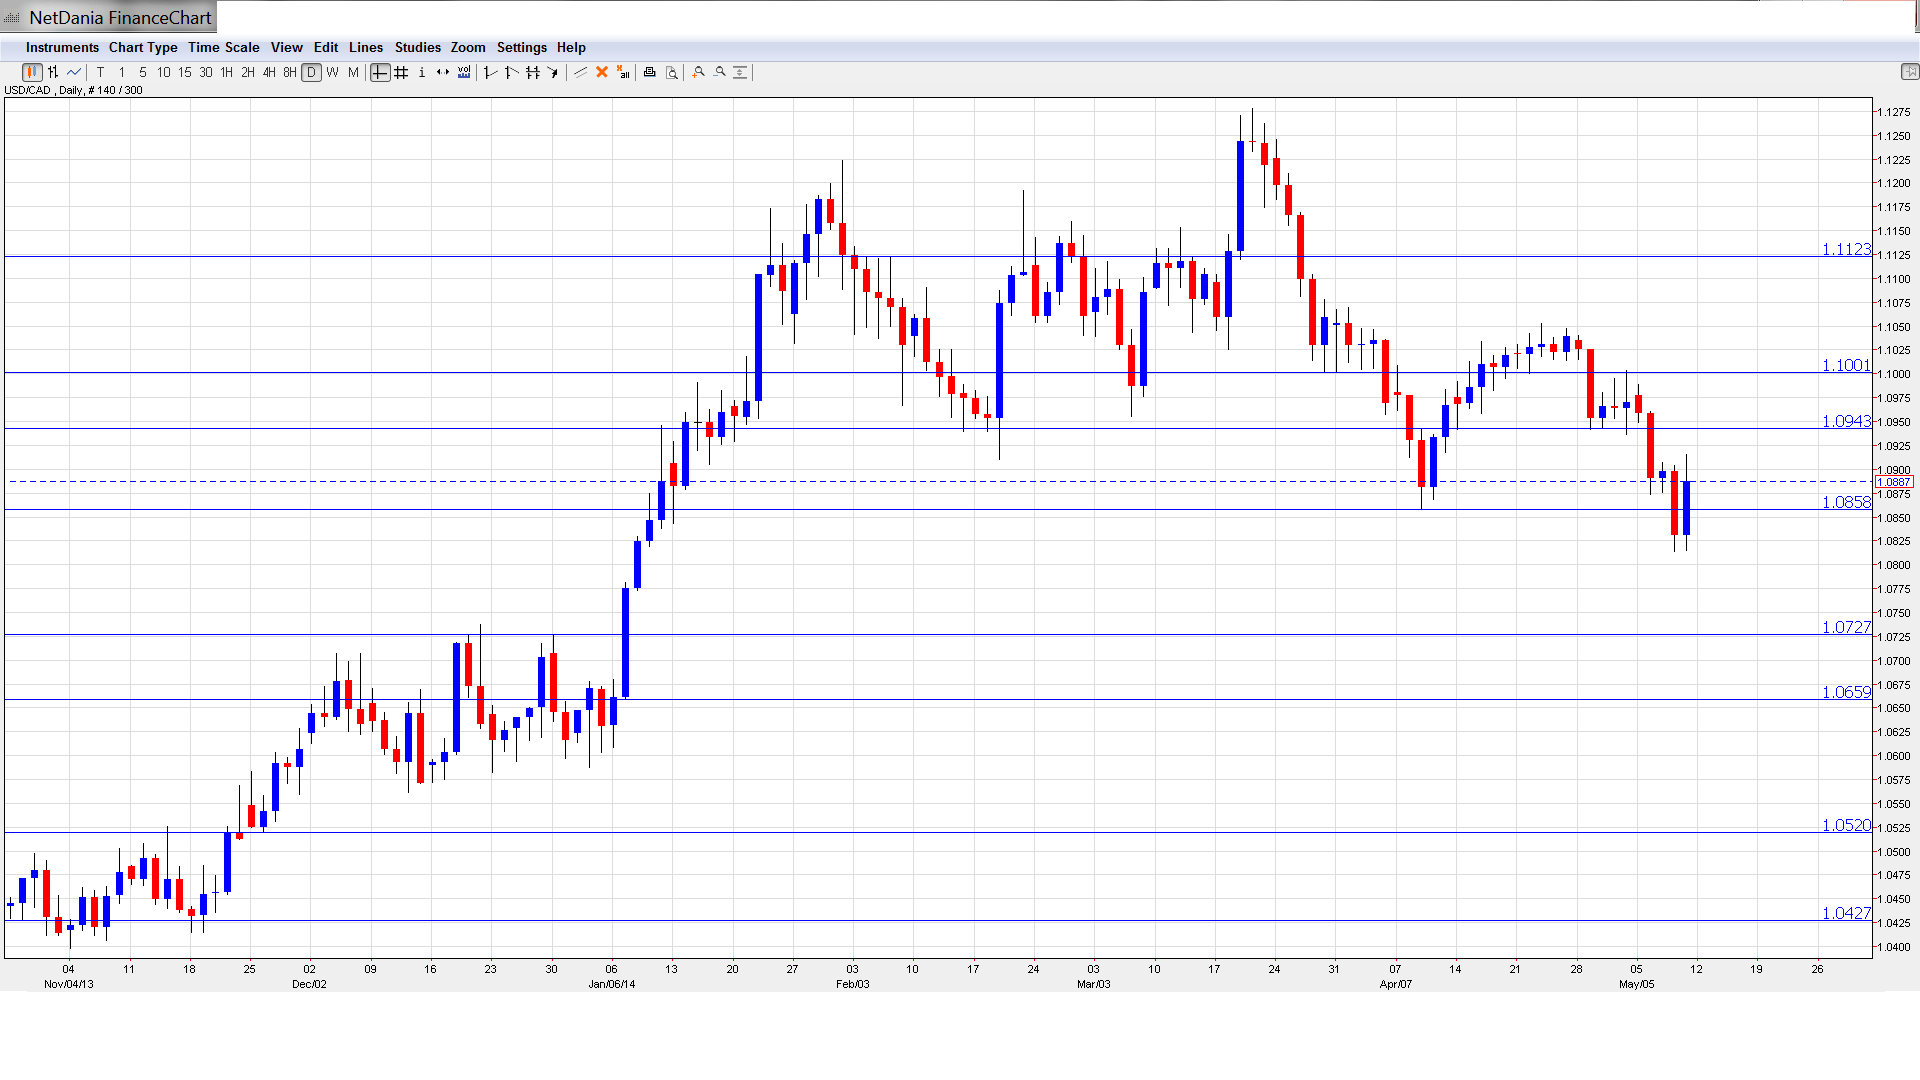
- BOC Review: Tuesday, 14:30. This minor report contains articles relating to the economy and central banking. Previously, the report was released on a quarterly basis, but has now changed to a bi-annual format.
- Manufacturing Sales: Thursday, 12:30. Manufacturing Sales is the major event of the week. The indicator has posted two strong gains, each time beating the forecast. The markets are expecting a weaker reading in April, with an estimate of just 0.2%.
- BOC Deputy Governor Lawrence Schembri Speaks: Thursday, 16:30. Schembri will address a financial forum in Quebec City. Analysts will be looking for clues regarding the BOC’s future monetary policy.
- Foreign Securities Purchases: Friday, 12:30. This indicator is closely linked to currency demand, as foreigners need to purchase Canadian dollars in order to buy Canadian securities. The indicator jumped to $6.08 billion last month, easily beating the estimate of $4.57 billion. The markets are expecting the upward trend to continue, with the April estimate standing at $7.21 billion.
USD/CAD Technical Analysis
USD/CAD opened the week at 1.0977 and quickly touched a high of 1.0989. The pair then dropped sharply, falling to a low of 1.0814, breaking below support at 1.0853 (discussed last week). USD/CAD closed the week at 1.0887.
Live chart of USD/CAD: [do action=”tradingviews” pair=”USDCAD” interval=”60″/]
Technical lines, from top to bottom:
We start with resistance at 1.1369. This line was breached in October 2008 as the US dollar posted sharp gains, climbing as high as the 1.21 level. This line has remained steady since July 2009.
1.1124 remains a strong resistance line. It has held firm since late March.
The psychological barrier of 1.10 saw a lot of action in April and is currently a strong resistance line.
1.0945 started last week in a weak support role, but has reverted to a resistance line as USD/CAD trades at lower levels.
1.0853 held firm in support as the pair dipped below the 1.009 line. It has remained intact since January.
1.0723 was a cap in mid-2010, before the US dollar tumbled and dropped all the way into 0.93 territory.
1.0660 saw a lot of activity in the second half of December and continues to provide strong support.
1.0519 has been a strong support line since late November.
1.0422 is the final support level for now. It was a key support line in mid-November.
I am bullish on USD/CAD
The US economy is relatively healthy, and recent employment NFP and unemployment claims have been strong. Canadian numbers have not kept pace, and Friday’s awful Employment Change hurt the Canadian dollar. So we could see the loonie cough up some gains and head back towards the 1.10 level.
Further reading:
- For a broad view of all the week’s major events worldwide, read the USD outlook.
- For EUR/USD, check out the Euro to Dollar forecast.
- For the Japanese yen, read the USD/JPY forecast.
- For GBP/USD (cable), look into the British Pound forecast.
- For the Australian dollar (Aussie), check out the AUD to USD forecast.
- USD/CAD (loonie), check out the Canadian dollar.
