USD/JPY reversed directions last week and lost over 100 points. The pair closed at 118.75. The upcoming week is a quiet one, with just five events. Here is an outlook on the major events moving the yen and an updated technical analysis for USD/JPY.
The US dollar lost ground on disappointing economic reports, including retail sales and housing data. There was better news late in the week as consumer confidence shot higher. Japanese numbers were uneventful and there were no surprises from the BOJ minutes.
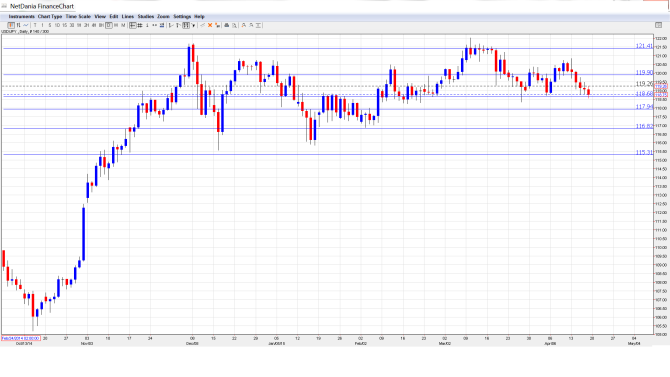
[do action=”autoupdate” tag=”USDJPYUpdate”/]USD/JPY graph with support and resistance lines on it:
- Tertiary Industry Activity: Sunday, 23:50. This minor indicator tends rebounded in January with a strong gain of 1.4%, marking a ten-month high. This easily beat the forecast of 1.6%. The markets are expecting a decline of 0.6% in the February report.
- Trade Balance: Tuesday, 23:50. Trade Balance is closely linked to currency demand, as foreigners must purchase Japanese yen in order to buy Japanese goods and services. In February, the trade deficit jumped to JPY 0.64 trillion, but this was considerably better than the forecast of JPY -1.21 trillion. The estimate for the March release stands at JPY -0.41 trillion.
- Flash Manufacturing PMI: Thursday, 1:35. The PMI has dipped in recent readings but remains above the 50-point level, which separates contraction from expansion. In March, the indicator dropped to 50.4 points, well below the forecast of 52.1 points. The markets are expecting a slight improvement in the April report, with an estimate of 50.8 points.
- SPPI: Thursday, 23:50. SPPI is a corporate inflation indicator. The indicator has been on a downturn and dropped to 3.3% in February, matching expectations. The markets are expecting the indicator to remain at 3.3% in the March report.
- All Industries Activity: Friday, 4:30. The indicator jumped to 1.9% in January, matching the forecast. This was the indicator’s strongest gain since June 2011. However, the markets are expecting the indicator to decline by 0.9% in the February release.
* All times are GMT
USD/JPY Technical Analysis
USD/JPY started the week at 120.20 and quickly climbed to a high of 120.84. The pair then reversed directions, dropping to a low of 118.56, breaking below support at 118.68 (discussed last week). USD/JPY closed the week at 118.75.
Live chart of USD/JPY: [do action=”tradingviews” pair=”USDJPY” interval=”60″/]
Technical lines from top to bottom:
We start with resistance at 124.16. This line marked the start of a yen rally in June 2007, which saw USD/JPY drop to the 96 level.
122.19 is the next resistance line.
121.39 remains a strong resistance line. The line held firm as the pair showed some strength late in the week.
119.88 continues to be busy in April and has switched to a resistance role as the yen trades at higher levels.
118.68 was tested but recovered and starts the week as a weak support line.
117.94 is an immediate support level.
116.82 has remained intact since mid-January. 115.85 is the next support line.
115.29 is the final support level for now. It has remained intact since December 2014.
I am bullish on USD/JPY
Although recent US numbers have not impressed, analysts expect better news in the spring, and market sentiment remains positive about the US economy. Japan continues to suffer from low inflation, leaving the BOJ little choice but to continue an aggressive monetary policy which continues to weigh on the weak yen.
In our latest podcast, we talk about The Confetti Lady that moved Draghi but not Markets
Subscribe to Market Movers on iTunes
Further reading:
- For a broad view of all the week’s major events worldwide, read the USD outlook.
- For EUR/USD, check out the Euro to Dollar forecast.
- For the Japanese yen, read the USD/JPY forecast.
- For GBP/USD (cable), look into the British Pound forecast.
- For the Australian dollar (Aussie), check out the AUD to USD forecast.
- For the kiwi, see the NZDUSD forecast.
