For a second straight week, USD/JPY pushed above the 125 line, but failed to consolidate these gains and showed no change at the end of the week. The upcoming week has six events, led by Preliminary GDP. Here is an outlook on the major events moving the yen and an updated technical analysis for USD/JPY.
The markets remain in a wait-and-see mode as to the timing of rate hike by the Fed, as the guessing game continues. Meanwhile, Retail Sales were strong, but employment and consumer confidence numbers were slightly lower than expected. Japanese data disappointed, as the current account surplus and manufacturing numbers fell short of expectations.
[do action=”autoupdate” tag=”USDJPYUpdate”/]
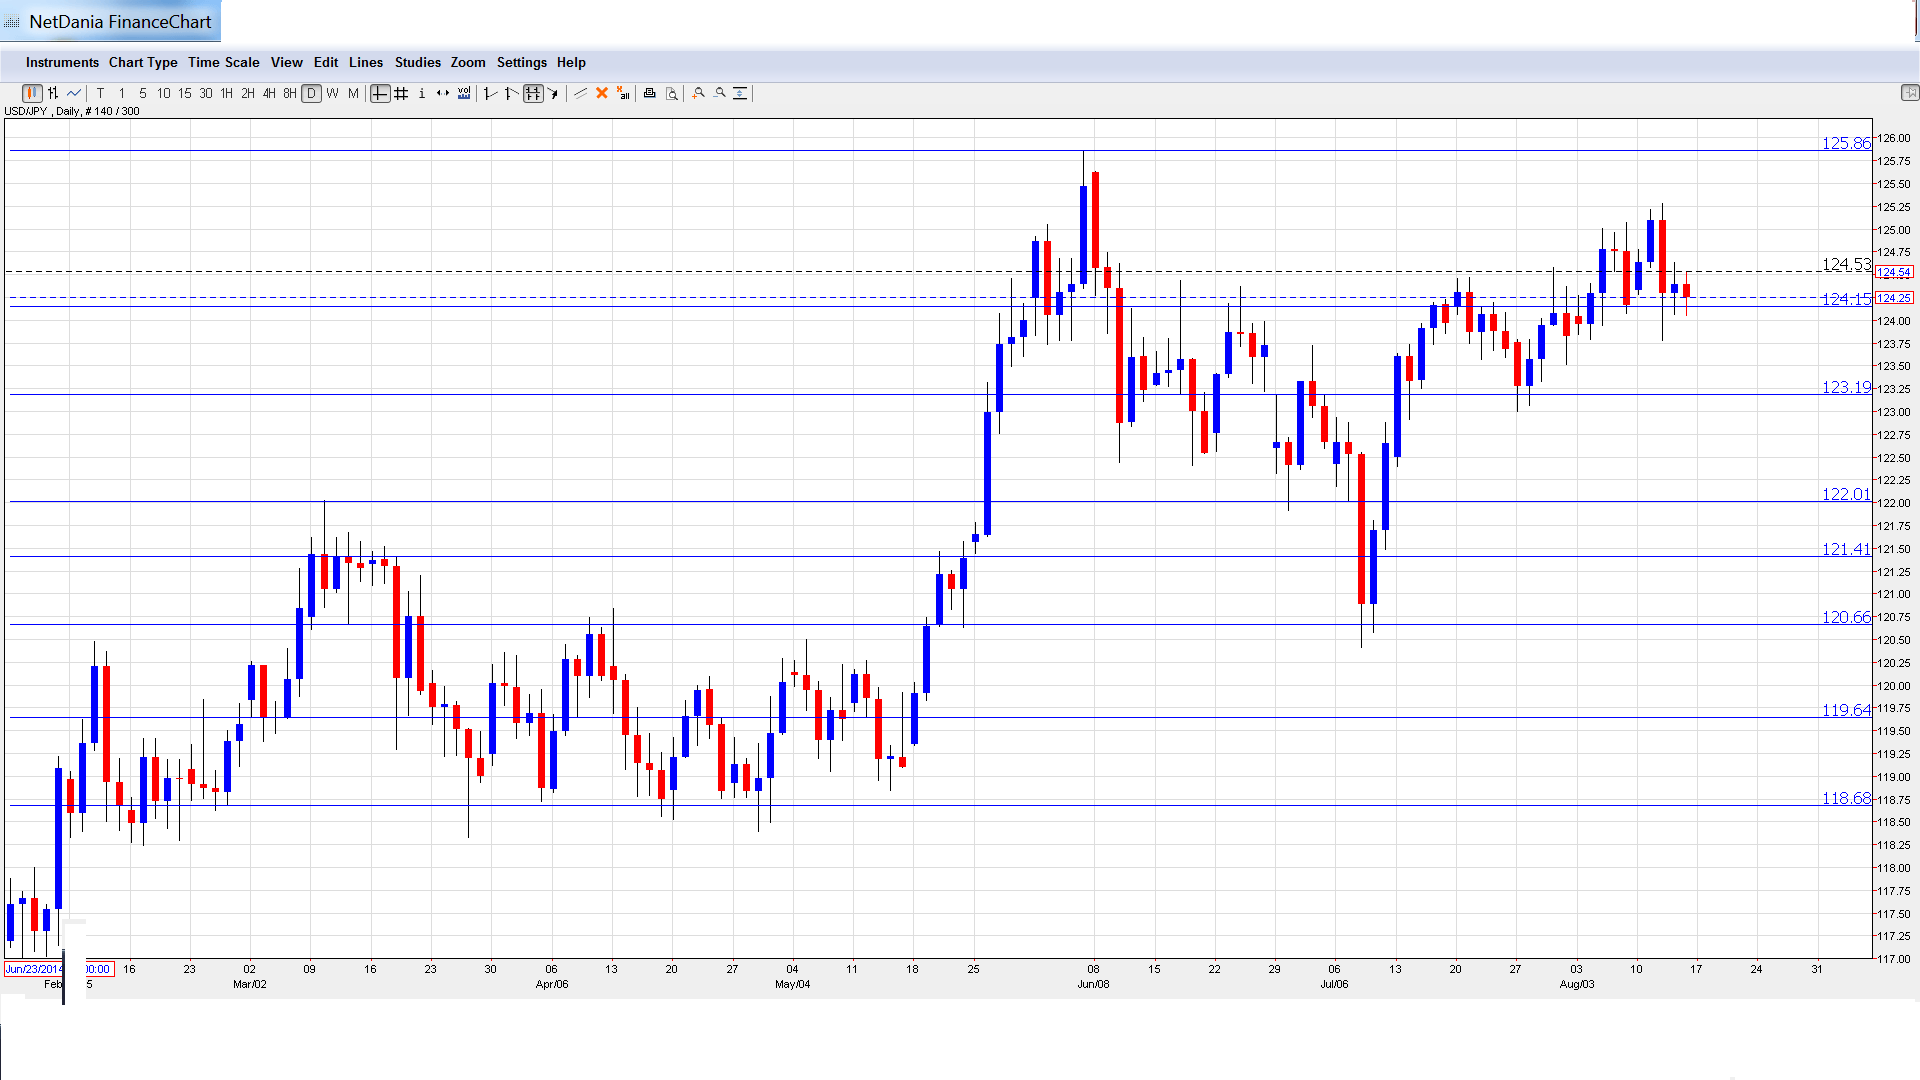
USD/JPY graph with support and resistance lines on it:
- Preliminary GDP: Sunday, 23:50. The week kicks off with Preliminary GDP, one of the most important indicators. An unexpected reading can have a significant effect on USD/JPY.
- Trade Balance: Tuesday, 23:50. Trade Balance is closely linked to currency demand, so traders should keep a close look at this indicator. The trade deficit widened in June to 0.25 trillion yen, matching expectations. The trade deficit is expected to fall to 0.16 trillion in the July report.
- All Industries Activity: Wednesday, 4:30. This minor indicator has struggled, posting two declines in the past three readings. The indicator came in at -0.5% in May, which matched expectations. The markets are expecting a much stronger release in June, with an estimate of +0.4%.
- Monetary Policy Statement: Thursday, Tentative. No surprises are expected from the BOJ in its policy statement, as Japan continues to struggle with a weak economy and low inflation. The central bank continues to apply extreme money easing in order to kick-start the economy. A press conference will follow.
- Flash Manufacturing PMI: Friday, 1:35. The PMI posted a reading of 51.4 points in July, which marked a six-month high. Will the upward trend continue in the August report?
* All times are GMT
USD/JPY Technical Analysis
USD/JPY opened the week at 124.33 and climbed to a high of 125.07. The pair then reversed directions and slipped to a low of 1.2378, testing support at 1.2416 (discussed last week). USD/JPY closed the week at 1.2425.
Live chart of USD/JPY: [do action=”tradingviews” pair=”USDJPY” interval=”60″/]
Technical lines from top to bottom:
We begin with resistance at 1.2878. This marked the start of a yen rally in May 2002, which saw USD/JPY fall below the 116 line.
127.74 is the next line of resistance.
126.59 has remained intact since May 2002.
125.86 continues to be a strong resistance line.
124.16 continues to be busy and was testing by the pair late in the week. Currently, this line is a weak support level and could see further action early in the week.
123.18 remains an immediate support line.
122.01 is the next support level.
121.39 was breached in early July as the dollar started its current rally.
120.65 is protecting the symbolic 120 level.
119.65 was a key support line in April.
118.68 is the final support line for now.
I am bullish on USD/JPY
The pair briefly broke past the symbolic 125 level for a second straight week – will it be “third time lucky” for the strong US dollar this week? The yen is not getting any support from a weak Japanese economy, so the dollar could post some gains.
In our latest podcast we discuss predictable currencies vs. unpredictable central banks.
Follow us on Stitcher.
Further reading:
- For a broad view of all the week’s major events worldwide, read the USD outlook.
- For EUR/USD, check out the Euro to Dollar forecast.
- For the Japanese yen, read the USD/JPY forecast.
- For GBP/USD (cable), look into the British Pound forecast.
- For the Australian dollar (Aussie), check out the AUD to USD forecast.
- For the kiwi, see the NZDUSD forecast.
