The US dollar continues to hammer the yen, as USD/JPY jumped 260 points last week. The pair closed at 121.14, marking a 6-week high. The upcoming week has eight events. Here is an outlook on the major events moving the yen and an updated technical analysis for USD/JPY.
The Federal Reserve was dovish in its January policy statement, lowering the chances of a hike in March, and US durables looked dismal last week. The BOJ shocked the markets by adopting negative interest rates. This sent the yen tumbling late in the week.
do action=”autoupdate” tag=”USDJPYUpdate”/]
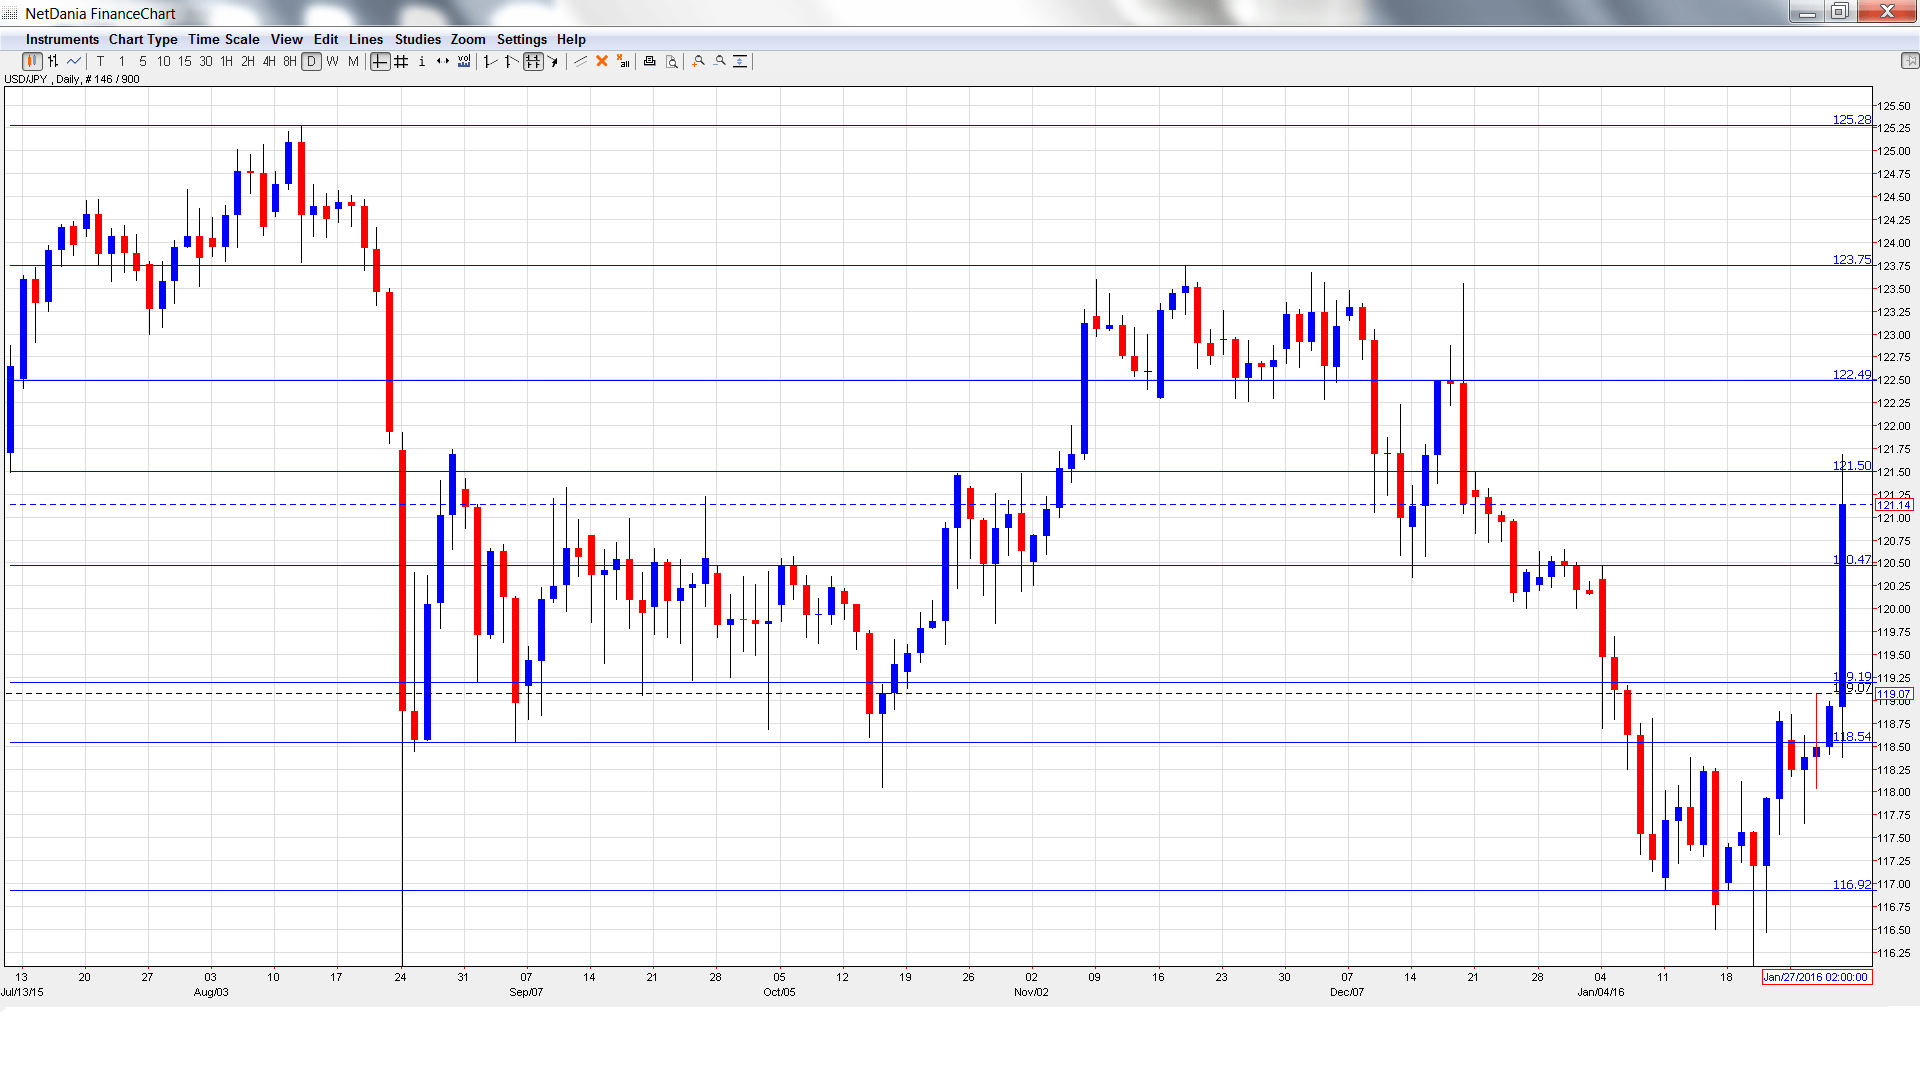
USD/JPY graph with support and resistance lines on it:
- Final Manufacturing PMI: Monday, 2:00. Japanese Trade Balance improved to 0.00 trillion yen in November, breaking a long streak of deficits. Will we see a surplus in December? The markets appear to think so, with an estimate of 0.08 trillion yen.
- Monetary Base: Monday, 23:50. SPPI measures inflation in the corporate sector. The index dipped to 0.2% in November, short of the estimate of 0.4%. The estimate for December is 0.2%.
- 10-year Bond Auction: Tuesday, 3:45. Retail Sales is the primary gauge of consumer spending, and an unexpected reading can have a strong impact on the movement of USD/JPY. The indicator slipped 1.0% in November, its second decline in three readings. The forecast for the December report is 0.2%.
- BOJ Governor Haruhiko Kuroda Speaks: Wednesday, 4:30. This important consumer indicator continues to struggle, and has posted just one gain in the second half of 2015. The November reading dipped to -2.9%, well below the forecast of -2.1%. Another decline is expected, with an estimate of -2.3%.
- Consumer Confidence: Wednesday, 5:00. Tokyo Core is the most important Japanese inflation indicator, and is closely watched by the markets. The index posted a small gain of 0.1% in December, matching expectations. Another gain of 0.1% is predicted for the January report.
- Leading Indicators: Friday, 5:00. The indicator came in at -1.0% in November, compared to the forecast of -0.4%. Another decline is expected in December, with an estimate of -0.3%.
* All times are GMT
Live chart of USD/JPY: [do action=”tradingviews” pair=”USDJPY” interval=”60″/]
USD/JPY Technical Analysis
USD/JPY opened the week at 118.65 and quickly touched a low of 117.65. The pair then reversed directions and climbed all the way to 121.69, testing resistance at 121.50. USD/JPY closed the week at 121.14.
Technical lines from top to bottom:
With the pair posting strong gains last week, we start at higher levels:
We start with resistance at 125.28.
123.75 was a cap in November.
122.49 is next.
121.50 marked the high point of a yen rally in December which saw USD/JPY drop to the 117 line. It was tested last week.
120.47 has switched to a support role following strong gains by the pair.
119.19 was easily breached as the yen posted sharp losses last week.
118.50 has strengthened in support.
116.90 supported dollar/yen early in 2015. It is the final support line for now.
I am bullish on USD/JPY
The BoJ surprised the markets by cutting rates into negative territory, in an attempt to kick-start the weak Japanese economy. The yen took a beating late in the week and this trend could continue. As expected, the Federal Reserve did not raise rates last week, so the markets will be looking for clues regarding a rate hike in March.
In our latest podcast we make sense of turbulent markets
Follow us on Sticher or on iTunes
Further reading:
- For a broad view of all the week’s major events worldwide, read the USD outlook.
- For EUR/USD, check out the Euro to Dollar forecast.
- For the Japanese yen, read the USD/JPY forecast.
- For GBP/USD (cable), look into the British Pound forecast.
- For the Australian dollar (Aussie), check out the AUD to USD forecast.
- For the kiwi, see the NZDUSD forecast.
