The Japanese yen enjoyed superb gains for a second straight week, as USD/JPY dropped 370 points and touched 15-month lows. The pair closed the week at 113.22. The upcoming week has five events. Here is an outlook on the major events moving the yen and an updated technical analysis for USD/JPY.
Weak oil prices and mixed US numbers helped the yen continues to post impressive gains against the greenback. US employment numbers showed some improvement, but consumer confidence was weaker than expected.
do action=”autoupdate” tag=”USDJPYUpdate”/]
USD/JPY graph with support and resistance lines on it:
- Preliminary GDP: Sunday, 23:50. GDP releases are among the most important indicators, and can have a significant impact on the movement of USD/JPY. Final GDP for Q3 came in at 0.3%, ahead of the forecast of 0.1%. Preliminary GDP for Q4 stands at -0.3%.
- Revised Industrial Production: Monday, 4:30. This manufacturing indicator sagged in November, posting a decline of 0.9%. This surprised the markets, which had expected a gain of 1.4%.
- Core Machinery Orders: Tuesday, 23:50. This indicator slumped in November, with a sharp decrease of 14.4%. This was well below expectations and the indicator’s worse showing since May 2014.
- Trade Balance: Wednesday, 23:50. Japanese trade balance has improved for three straight months, and the December report showed a small surplus of 0.04 trillion yen. This was short of the estimate of 0.08 trillion. The upward trend is expected to continue, with the January estimate standing at 0.06 trillion yen.
- All Industries Activity: Friday, 4:30. This indicator is pointing to trouble in the Japanese economy, with three declines in the past four readings. The indicator posted a decline of 1.0% in the November reading, and the estimate for December stands at -0.3%.
* All times are GMT
Live chart of USD/JPY: [do action=”tradingviews” pair=”USDJPY” interval=”60″/]
USD/JPY Technical Analysis
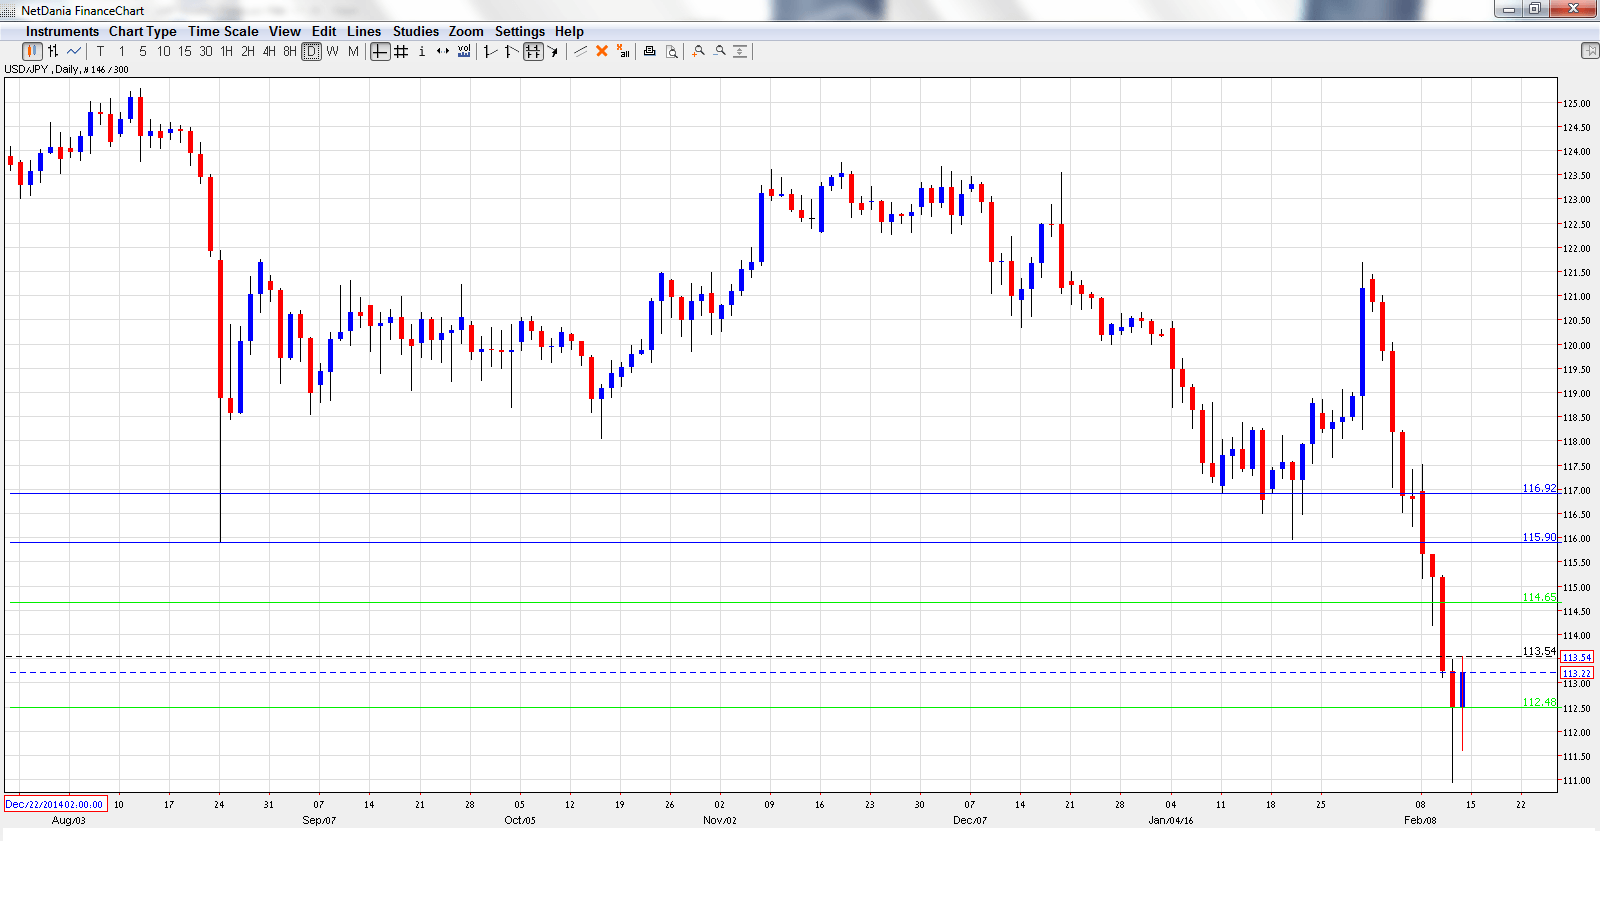
USD/JPY opened the week at 116.95 and quickly touched a high of 117.52. It was all downhill from there, as the pair dropped all the way to 110.94, before moving to higher ground. USD/JPY closed the week at 113.22, as 113.71 switched to resistance (discussed last week).
Technical lines from top to bottom:
With the pair posting sharp losses last week, we start at lower levels:
116.90 supported dollar/yen early in 2015.
115.90 was an important cushion for most of 2015.
114.65 is next.
113.71 was an important resistance line in July 2005.
112.48 marked the start of a yen rally in January 2008, which saw USD/JPY drop below the 100 level.
110.68 represented a high point of a strong dollar rally in August 2008, which started around the key 100 level.
108.58 is the final support line for now.
I am neutral on USD/JPY
The tremendous yen rally kept on strong for a second straight week, as nervous investors continued to flock to the safe-haven yen in response to ongoing global financial turbulence. US fundamentals are still much better than those of Japan, and speculation about a Fed rate hike in March is bullish for the US dollar.
Our latest podcast is titled What’s the Deal with the Death Cross? + Yellen and yen
Follow us on Sticher or on iTunes
Further reading:
- For a broad view of all the week’s major events worldwide, read the USD outlook.
- For EUR/USD, check out the Euro to Dollar forecast.
- For the Japanese yen, read the USD/JPY forecast.
- For GBP/USD (cable), look into the British Pound forecast.
- For the Australian dollar (Aussie), check out the AUD to USD forecast.
- For the kiwi, see the NZDUSD forecast.
