USD/JPY ticked lower within the range. Will we see it take a new direction? A relatively wide array of economic indicators awaits us this week. Here is an outlook on the major events moving the yen and an updated technical analysis for USD/JPY.
The effect of the sales tax hike was clearly seen with the release of retail sales: these plunged by 4.4%, more than estimated and following a pre-hike shopping spree of 11% in March. Inflation numbers came in within expectations and strengthen the notion that the BOJ will refrain from action. In the US, the past looks worse with a bigger than expected contraction, while the present looks rosier.
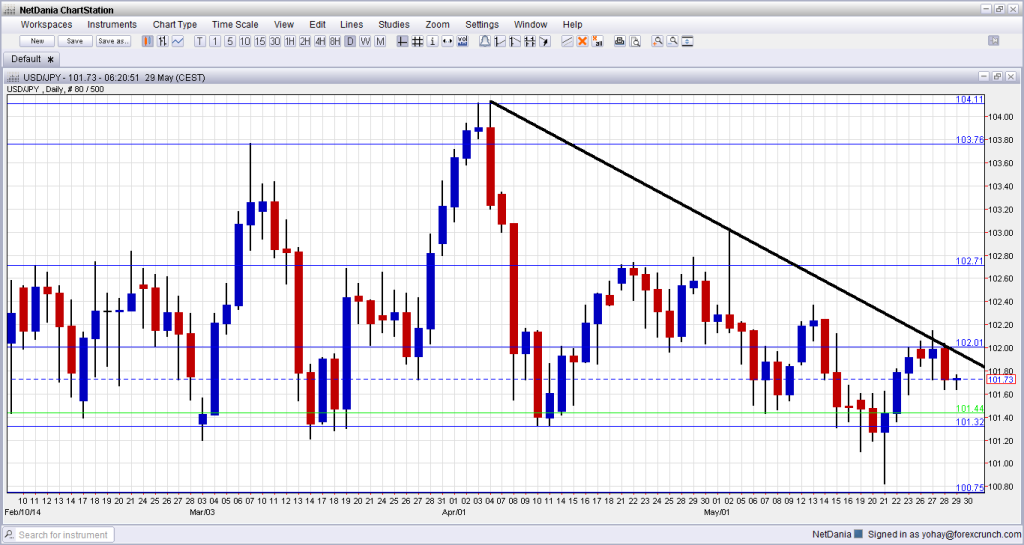
[do action=”autoupdate” tag=”USDJPYUpdate”/]USD/JPY graph with support and resistance lines on it. Click to enlarge:
- Capital Spending: Sunday, 23:50. This quarterly measure serves as an indicator for future economic growth. In Q4 2014, growth disappointed with only 4%, even though it was the highest in many years. A similar figure is likely for Q1 2014.
- Final Manufacturing PMI: Monday, 1:35. Markit’s purchasing managers’ index remained below the 50 point line separating growth from contraction for the second consecutive month according to the first release: 49.9 points. The figure will likely be confirmed now. A rise above 50 points will be received positively.
- Monetary Base: Monday, 23:50. Japan’s monetary base is on the rise since Kuroda announced his monetary blitz in April 2013. The balance sheet of the BOJ is expanding at a double digit pace (year over year). After a slide to 48.5% in April, an even lower growth rate is due now.
- Average Cash Earnings: Tuesday, 1:30. The Japanese government wants companies to raise wages in order to stimulate the economy. After a y/y rise of 0.7% in March, a drop is expected in April – the month when the sales tax hike came into effect.
- Leading Indicators: Friday, 5:00. 11 economic indicator build up the number, which has surprised to the upside in March with 107.1%. For April, a drop is predicted, yet again due to the tax.
* All times are GMT
USD/JPY Technical Analysis
Dollar/yen began the week capped under the round 102 line (mentioned last week). A move above this line proved short lived.
Technical lines from top to bottom
The top line is the peak seen in the turn of the year: 105.44. This was challenged several times. Below, 104.80 capped the pair during January.
104.10, the high of April 2014 is currently a minor line, but should be watched. Below, 103.77 provided support for the pair in January and served as a clear separator of ranges.
102.74 was a stubborn peak during February and is the top line of the current trading range. 102.00 is a round number that supported the pair several times and is the botom of the range.
101.30 provided strong support for the pair during May 2014 and is the low line of support. 100.75 prevented the pair from falling lower during February and is the last backstop before the round number of 100.
100 is not just a round number but also worked as resistance several times in the past.
Downtrend resistance
Since peaking above 104 in early April, the pair is capped by downtrend resistance, clearly formed in early May and tested once again now.
I am bullish on USD/JPY
The Bank of Japan may be reluctant to act,but it will probably not allow the yen to strengthen. In addition, the improving conditions in the US economy support a gradual rise of the pair, despite low US bond yields.
More yen:
Further reading:
- For a broad view of all the week’s major events worldwide, read the USD outlook.
- For EUR/USD, check out the Euro to Dollar forecast.
- For GBP/USD (cable), look into the British Pound forecast.
- For the Australian dollar (Aussie), check out the AUD to USD forecast.
- For USD/CAD (loonie), check out the Canadian dollar forecast.
- For the kiwi, see the NZDUSD forecast.
