USD/JPY posted modest losses last week, closing at 122.59. The upcoming week has five events on the schedule, highlighted by Preliminary GDP. Here is an outlook on the major events moving the yen and an updated technical analysis for USD/JPY.
Key US numbers were mixed last week, as the markets continue to speculate about a rate hike in December. PPI and Retail Sales missed estimates, but UoM Consumer Sentiment beat the forecast. Earlier in the week, US jobless claims repeated at 276 thousand, coming in above the forecast for a second straight week. The Fed is leaning towards a hike, but by no means is it a done deal. In Japan, Current Account was well below expectations.
do action=”autoupdate” tag=”USDJPYUpdate”/]
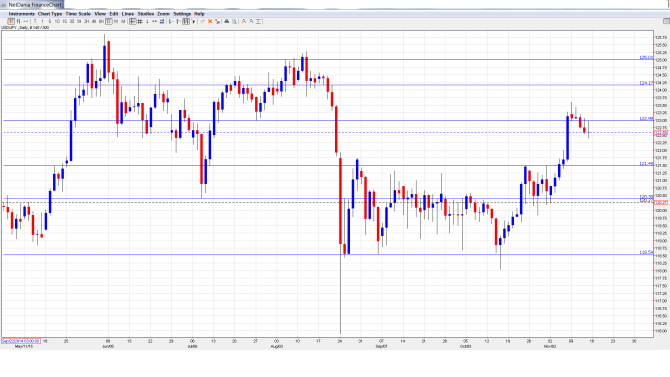
USD/JPY graph with support and resistance lines on it:
- Preliminary GDP: Sunday, 23:50. GDP is one of the most important economic indicators, and should be treated as a market-mover. Final GDP for Q2 came in at -0.3%, indicative of a contracting economy. Preliminary GDP for Q3 is not much better, with an estimate of -o.1%.
- Trade Balance: Wednesday, 23:50. The monthly trade deficit has been steady, with two straight readings of JPY -0.36 trillion. The markets are expecting a slightly larger deficit in October, with an estimate of JPY -0.38 trillion.
- BOJ Monetary Policy Statement: Thursday, Tentative. The BOJ has kept a steady hand when it comes to monetary policy, but with a sluggish economy and little inflation, there is strong pressure to increase stimulus. Such a move would likely send the struggling yen to lower against the US dollar.
- All Industries Activity: Thursday, 4:30. The indicator slipped to -0.2% in August, which was within expectations. The markets are expecting better news in September, with an estimate of +0.2%.
- BOJ Monthly Report: Friday, 5:00. This report, which is a minor event, provides details of the BOJ’s view of economic conditions. It is unlikely to have much effect on the movement of USD/JPY, but is useful in understanding the central bank’s mindset regarding the economy and future monetary policy.
* All times are GMT
Live chart of USD/JPY: [do action=”tradingviews” pair=”USDJPY” interval=”60″/]
USD/JPY Technical Analysis
USD/JPY opened the week at 123.19 and climbed quickly climbed to a high of 123.60, as resistance held firm at 124.16 (discussed last week). The pair then reversed directions, and dropped to a low of 122.39. USD/JPY closed the week at 122.59.
Technical lines from top to bottom:
126.59 has remained intact since May 2002.
The very round number of 125 remains an important resistance line.
124.16 was an important cap in late June.
The round number of 123 was a swing low in July and has switched to a resistance role. It is a weak line.
121.50 is the next line of support.
120.40, which was a swing low in July, is next.
118.55 has held firm since early October. It is the final support level for now.
I am bullish on USD/JPY
A stellar Nonfarm Payrolls has increased the likelihood of a rate hike, and this week’s CPI report and Fed minutes are market-movers which will be highly anticipated by the markets. An improvement in inflation would bolster the case for a rate hike in December, and the US dollar would likely get a boost against its rivals.
In our latest podcast we discuss the December decision driving the dollar, declining oil and more:
Follow us on Sticher or on iTunes
Further reading:
- For a broad view of all the week’s major events worldwide, read the USD outlook.
- For EUR/USD, check out the Euro to Dollar forecast.
- For the Japanese yen, read the USD/JPY forecast.
- For GBP/USD (cable), look into the British Pound forecast.
- For the Australian dollar (Aussie), check out the AUD to USD forecast.
- For the kiwi, see the NZDUSD forecast.
