USD/JPY posted modest losses last week, closing at 122.59. The upcoming week has four events. Here is an outlook on the major events moving the yen and an updated technical analysis for USD/JPY.
The Federal Reserve minutes didn’t contain any surprises, as the guessing game continues regarding a rate hike in December. US Core Inflation met expectations, with a gain of 1.9%. Japanese GDP declined at an annualized rate of 0.8% in Q3, marking back-t0-back declines which indicates that the economy is in a recession. The BOJ released its monetary policy statement last week. The central bank made no moves, opting to maintain its current monetary policy.
do action=”autoupdate” tag=”USDJPYUpdate”/]
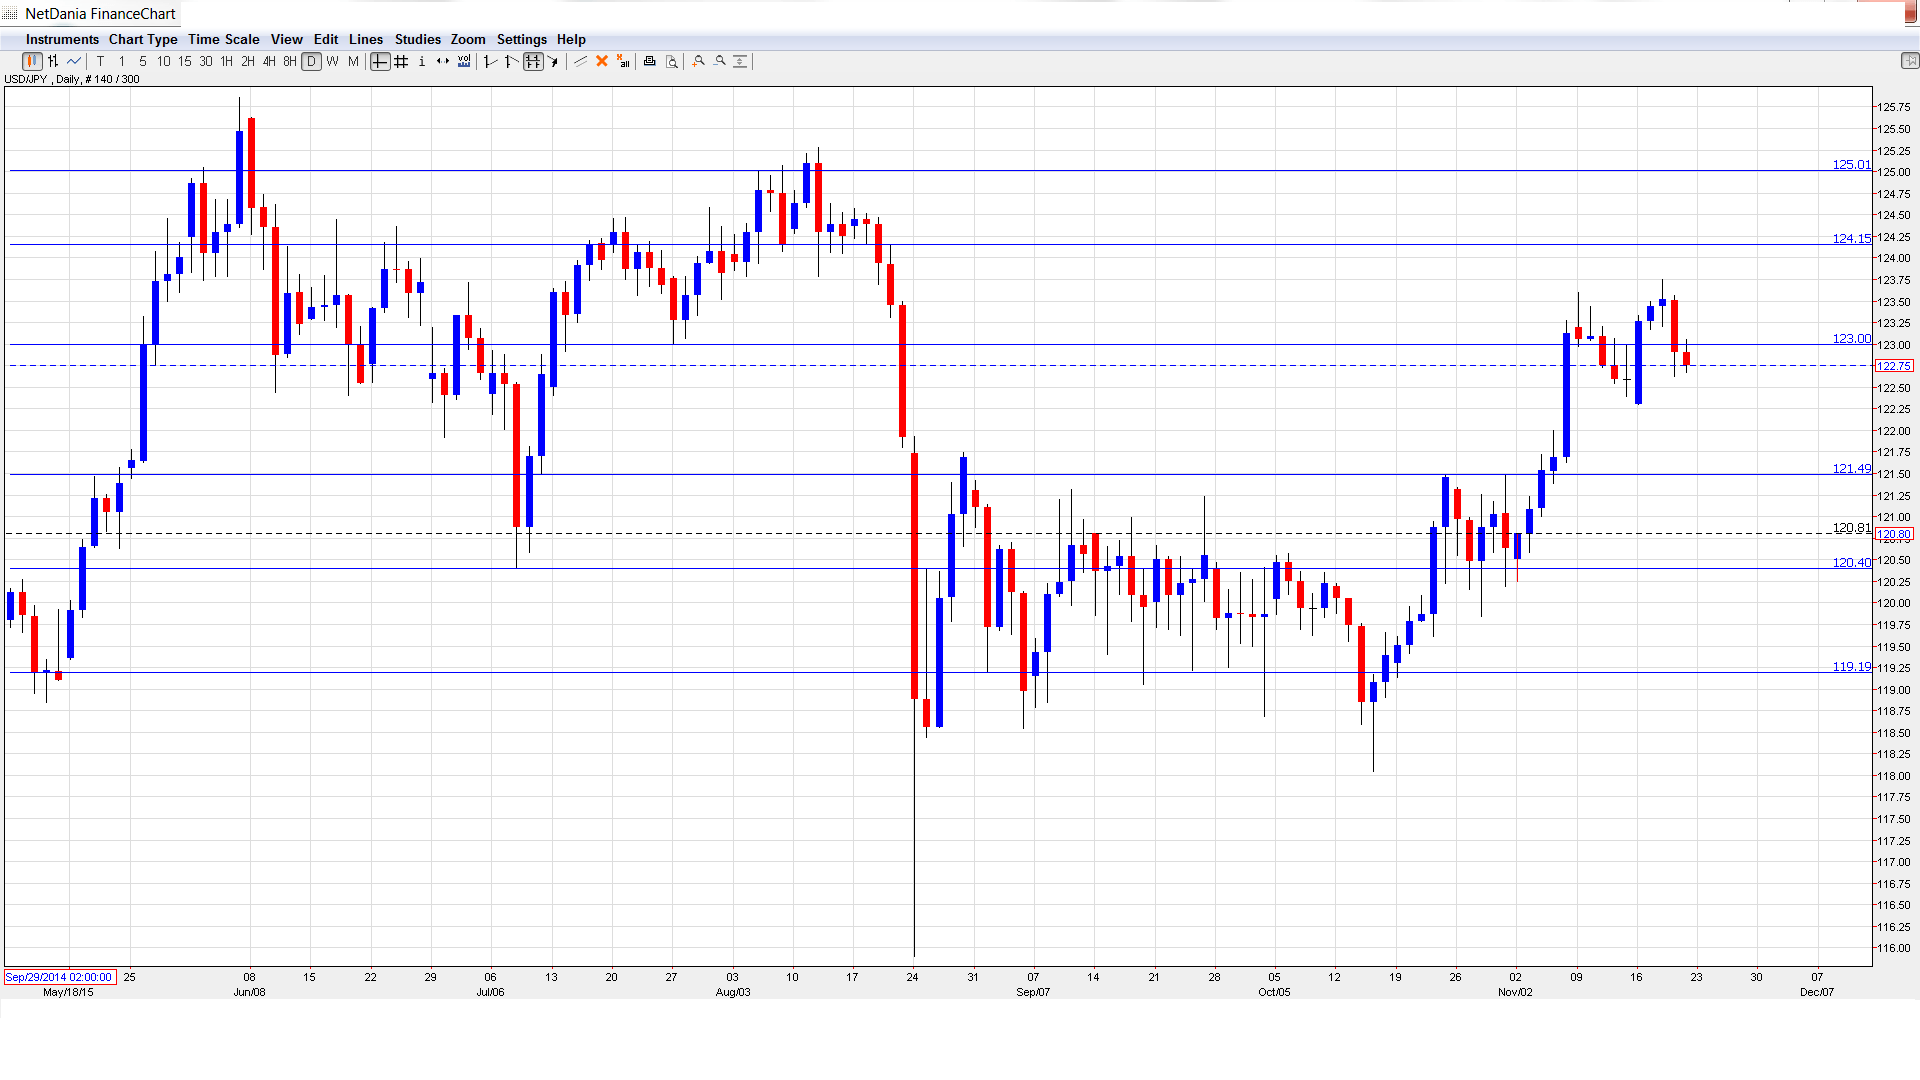
USD/JPY graph with support and resistance lines on it:
- Flash Manufacturing PMI: Tuesday, 1:35. The PMI has posted four straight readings above the 50 level, which indicates ongoing expansion in the manufacturing sector. The October release improved to 52.5 points, beating the estimate of 50.6 points. This marked a 12-month high. The estimate for the November report stands at 52.1 points.
- BOJ Monetary Policy Meeting Minutes: Tuesday, 23:50. The BOJ will release the minutes of last week’s policy meeting, at which the BOJ maintained its current monetary policy. Any hints in the minutes of further easing steps could send the yen to lower levels.
- Household Spending: Thursday, 23:30. Household Spending is an important gauge of consumer spending, a key driver of economic growth. The indicator sagged in September, posting a decline of 0.4%. This was well off the estimate of +1.2%. The markets are expecting a flat reading of 0.0% in the October report.
- Tokyo Core CPI: Thursday, 23:30. Japanese inflation indicators continue to point toward deflation. Tokyo Core CPI, the primary gauge of consumer inflation, has pointed to negative inflation for four consecutive months. Another decline is expected, with the estimate standing at -0.1%.
* All times are GMT
Live chart of USD/JPY: [do action=”tradingviews” pair=”USDJPY” interval=”60″/]
USD/JPY Technical Analysis
USD/JPY opened the week at 122.30, which was the low of the week. The pair climbed to a high of 123.75, as resistance held firm at 124.16 (discussed last week). The pair was unable to consolidate at this level, and USD/JPY closed the week at 122.75.
Technical lines from top to bottom:
126.59 has remained intact since May 2002.
The very round number of 125 remains an important resistance line.
124.16 held firm for a second straight week. This line was an important cap in late June.
The round number of 123 was tested and is currently a weak resistance line. It could see further action early in the week.
121.50 was the high in September and a key resistance line.
120.40, which was a swing low in July, is next.
119.19 has held firm since October. It is the final support level for now.
I am bullish on USD/JPY
With speculation rising that the Fed could press the rate trigger in December, the US dollar is in an excellent position to post broad gains. Revisions to US Preliminary GDP will be released during the week, and a strong reading could bolster the US dollar. Japan will release inflation figures, and if these indicators point to deflation, the yen could lose ground.
Our latest podcast is titled Between Terror and Thanksgiving:
Follow us on Sticher or on iTunes
Further reading:
- For a broad view of all the week’s major events worldwide, read the USD outlook.
- For EUR/USD, check out the Euro to Dollar forecast.
- For the Japanese yen, read the USD/JPY forecast.
- For GBP/USD (cable), look into the British Pound forecast.
- For the Australian dollar (Aussie), check out the AUD to USD forecast.
- For the kiwi, see the NZDUSD forecast.
