The Japanese yen rebounded last week, as USD/JPY dropped about 115 points, closing just under the 120 level. This week’s highlight is Tokyo Core CPI. Here is an outlook on the major events moving the yen and an updated technical analysis for USD/JPY.
In the US, the Federal Reserve kept the markets guessing till the very last minute, but in the end refrained from raising rates and the yen took full advantage, posting strong gains against the dollar. US unemployment claims were better than expected, but the Philly Manufacturing Index posted a sharp decline, well below expectations. There were no major economic releases out of Japan.
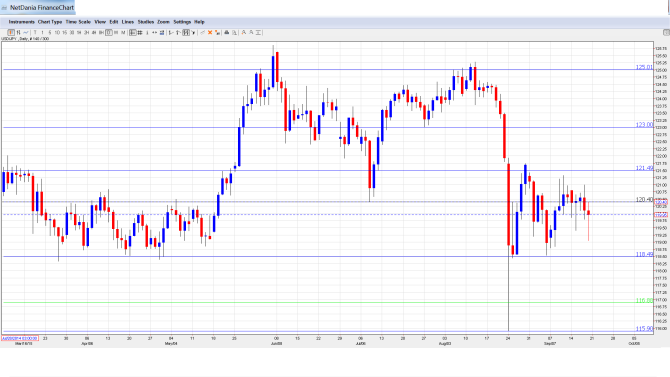
[do action=”autoupdate” tag=”USDJPYUpdate”/]USD/JPY graph with support and resistance lines on it:
- Flash Manufacturing PMI: Thursday, 1:35. This PMI has posted back-to-back readings over the 50 level, which points to expansion in the manufacturing sector. The index improved to 51.9 points in August, which was within expectations. The forecast for the September report stands at 51.3 points.
- All Industries Activity: Thursday, 4:30. This indicator is a minor event, as much of the data was covered by the Tertiary Industry Activity Report, which was released last week. The indicator improved in June with a gain of 0.3%, meeting expectations. This also marked a 5-month high. The markets are expecting a softer release in July, with an estimate of 0.1%.
- Tokyo Core CPI: Thursday, 23:30. This indicator is the most important inflation indicator out of Japan and should be treated as a market-mover. The index continues to struggle, having posted two straight readings of -0.1%. Another decline is expected in the September report, with an estimate of -0.2%.
- SPPI: Thursday, 23:50. This indicator measures inflation in the corporate sector. This index has been stronger than other inflation indices, posting a respectable gain of 0.6% in July. This beat the estimate of 0.4%. Little change is expected in the August report, with the estimate standing at 0.5%.
* All times are GMT
USD/JPY Technical Analysis
USD/JPY opened the week at 120.80. The pair showed some volatility late in the week, touching a high of 120.99 and testing resistance at 120.40 (discussed last week). The yen then recovered, as USD/JPY closed the week at 119.95.
Live chart of USD/JPY: [do action=”tradingviews” pair=”USDJPY” interval=”60″/]
Technical lines from top to bottom:
We start with a top level at the round number of 125.
Another round number, 123, was a swing low in July and remains of importance. 121.50 is the high in September and importance resistance.
120.40, which was a swing low in July, defends the round level of 120.
118.50 is the next key level after working as such during the spring and also lately.
116.90 supported dollar/yen early in the year and is a stepping stone towards the crash low of 115.90.
I am bearish on USD/JPY
The Fed remained on the sidelines yet again, leaving rates untouched. The yen responded by gaining ground late in the week, and the yen rally could continue into this week.
In our latest podcast we explain why the dollar defies the doves
Further reading:
- For a broad view of all the week’s major events worldwide, read the USD outlook.
- For EUR/USD, check out the Euro to Dollar forecast.
- For the Japanese yen, read the USD/JPY forecast.
- For GBP/USD (cable), look into the British Pound forecast.
- For the Australian dollar (Aussie), check out the AUD to USD forecast.
- For the kiwi, see the NZDUSD forecast.
