The yen continues to drop, as USD/JPY gained about 160 points last week. The pair closed the week just shy of the 109 level, marking a six-year high. The upcoming week is a quiet one, with only three events on the calendar. Here is an outlook on the major events moving the yen and an updated technical analysis for USD/JPY.
The yen lost ground following weak economic forecasts out of Japan as well as the FOMC statement, as the Fed hinted that once rates are raised, subsequent hikes could take place more quickly than expected. The 110 level looks closer than beforehand.
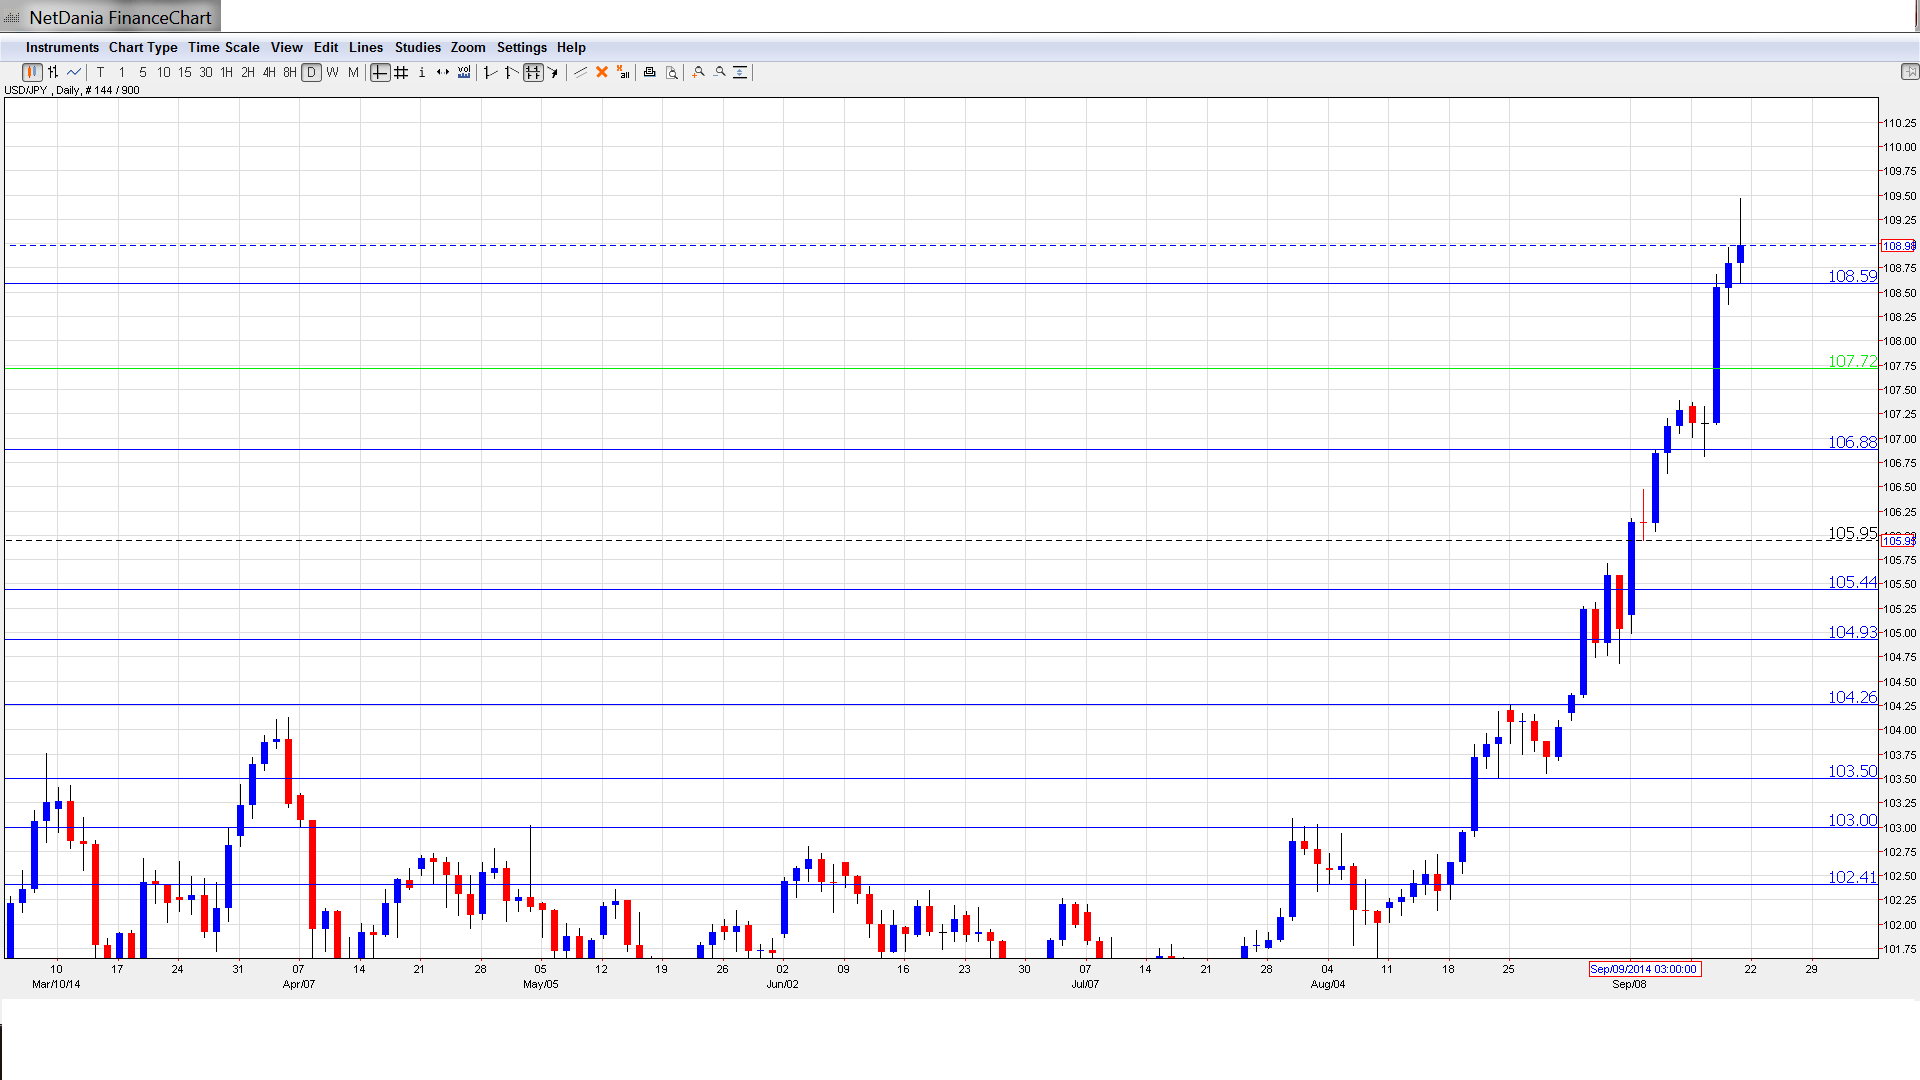
[do action=”autoupdate” tag=”USDJPYUpdate”/]USD/JPY graph with support and resistance lines on it:
- Flash Manufacturing PMI: Wednesday, 1:35. This index is an important gauge of activity in the manufacturing sector. The indicator remains above the 50 point-level, indicative of expansion. The July reading improved to 52.4 points, beating the estimate of 51.7 points. More of the same is expected in the upcoming release, with an estimate of 52.5 points.
- SPPI: Wednesday, 23:50. The Services Producer Price Index is used to track corporate inflation levels. The index has posted strong readings since April, and came in at 3.7% last month, matching the forecast. No change is expected in the August release.
- Tokyo Core CPI: Thursday, 23:30. This index is the primary gauge of consumer inflation, and should be treated as a market-mover. Inflation levels have improved drastically in recent months, and the July release posted a strong gain of 2.7%, matching the forecast. The markets are expecting an identical reading in the upcoming release. National Core CPI is expected to post a sharp gain of 3.2%, very close to the previous release of 3.3%.
* All times are GMT
USD/JPY Technical Analysis
Dollar/yen started the week at 107.33 and touched a low of 106.81. It was all uphill after that, as the pair broke above resistance at 108.58 (discussed last week) and reached a high of 109.46. The pair closed at 108.98.
Live chart of USD/JPY: [do action=”tradingviews” pair=”USDJPY” interval=”60″/]
Technical lines from top to bottom:
With USD/JPY continuing to move upwards, we start at higher levels:
114.65 has provided resistance since December 2007.
112.48 has remained intact since January 2008.
110.68 represented a high point of a strong dollar rally in August 2008, which started around the key 100 level.
108.58 was last tested in June 2008.
107.68 began last week as a weak resistance line and was easily breached by the pair. This line is currently providing strong support.
106.88 is next. This line switched to a support role earlier in September.
105.44 had held firm since December.
104.92 capped the pair around the turn of the year.
104.25 was an important resistance line back in August and continues to provide strong support.
It is followed by 1.0350, which was the bottom of the range after the big leap.
The round number of 103 showed its strength in late July 2013. It is the final support level for now.
I am bullish on USD/JPY
The US economy continues to improve, as unemployment claims dropped sharply last week. The divergence in monetary policy is weighing on the yen, as the BoJ considers additional stimulus while the Fed is on the verge of wrapping up QE.
- For a broad view of all the week’s major events worldwide, read the USD outlook.
- For EUR/USD, check out the Euro to Dollar forecast.
- For GBP/USD (cable), look into the British Pound forecast.
- For the Australian dollar (Aussie), check out the AUD to USD forecast.
- For USD/CAD (loonie), check out the Canadian dollar forecast.
- For the kiwi, see the NZDUSD forecast.
