- The SuperTrend indicator has flipped bullish, giving a signal to long Stellar.
- The Bollinger Band squeeze points at a possible breakout in the near-term.
- XLM may continue with the breakdown if the MACD indicator dives into the negative region.
Stellar is in the middle of consolidation, following a breakdown from the yearly high of $0.6. Support at $0.3 played a crucial role in ensuring that XLM does not extend the bearish leg. A recovery came into the picture, but XLM’s price action has been limited to under $0.5 for several weeks. Note that the ongoing consolidation is likely to culminate in a massive breakout toward $0.6.
Stellar is moving closer to a breakout
Stellar is trading slightly under the Bollinger Bands’ middle boundary, hence the bearish impulse. Higher support is needed to ensure that XLM resumes the uptrend toward $0.6. The SuperTrend indicator has flipped bullish, giving a signal to traders to go long on XLM.
The SuperTrend indicator suggests to investors when to sell or buy an asset. The buy signal comes into the picture when the indicator turns green and flips under the price.
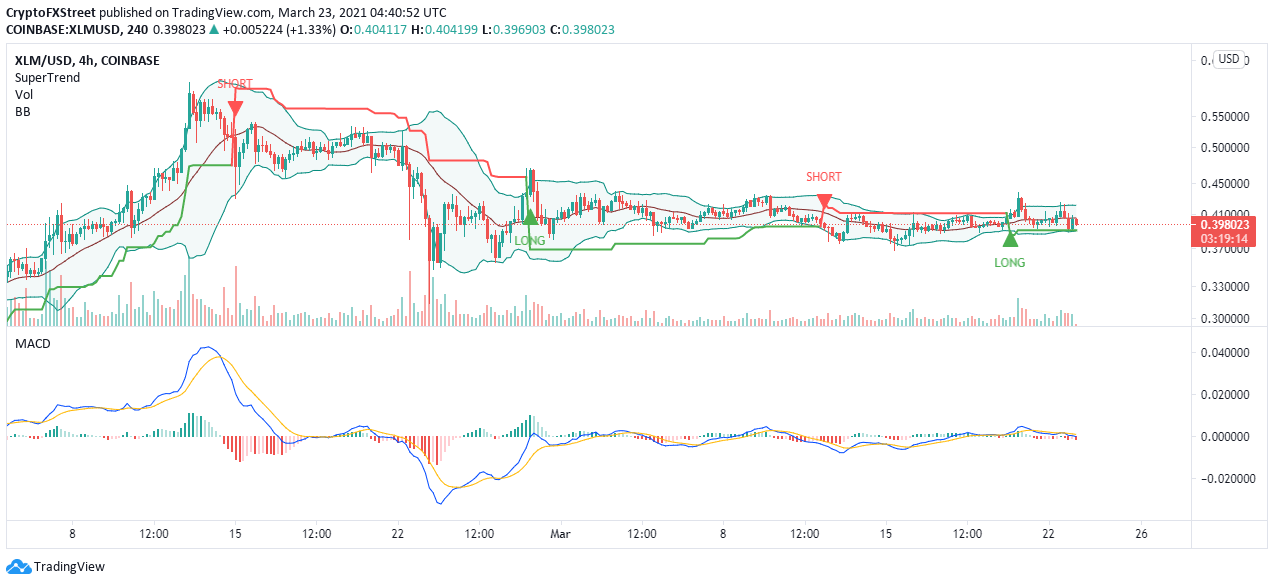
XLM/USD 4-hour chart
The 4-hour chart also shows the bulls fighting to secure support at the 50 Simple Moving Average (SMA). On the upside, the 100 SMA limits movement. Trading above this short-term resistance is likely to bolster Stellar and jumpstart it into a trajectory toward $0.6.
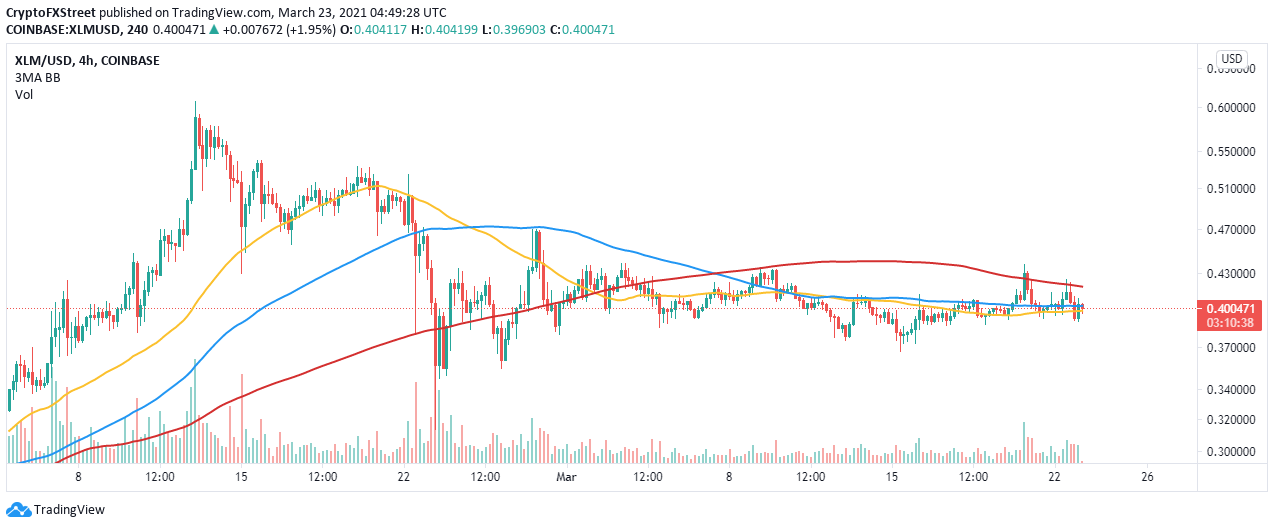
XLM/USD 4-hour chart
Looking at the other side of the fence
It is worth mentioning that the Moving Average Convergence Divergence (MACD) has a negative gradient. If the MACD line (blue) stays under the signal line, we will likely see Stellar continuing with the downtrend back to $0.3. The Bollinger Band constriction can also result in a breakdown as opposed to the expected upswing.
