EURUSD Daily Analysis
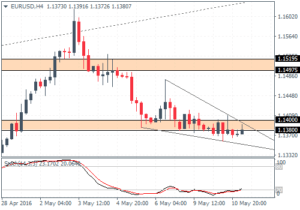
EURUSD (1.13): EURUSD posted declines for 6 consecutive days with price closing at 1.1371 yesterday. However, the range (open/close) of the candlesticks has declined to indicate a lack of momentum. This could potentially signal a near-term correction to the upside. Resistance is seen near 1.1470 while a close below yesterday’s low at 1.1358 could signal further downside to 1.130. On the 4-hour chart, price action continues to consolidate near the support zone of 1.14 and 1.1380 and has formed a falling wedge pattern with a doji formed and the current 4-hour candlestick staying bullish. A bullish close here and preferably above the doji’s high of 1.1381 could signal an upside breakout. While 1.1470 remains a key level to watch, EURUSD could rally to as high as 1.14975 to form a lower high.
USDJPY Daily Analysis
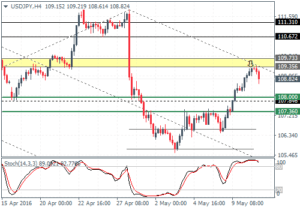
USDJPY (108.8): USDJPY is currently bearish but price briefly opened higher. A bearish close today could signal a move to 107.955 – 107.70 support. Watch for a lower high in USDJPY which could signal a move to 111.0 in the near term. On th 4-hour chart, the hidden divergence is currently seeing prices falling lower after a brief test near 109.35 – 109.73 resistance. The downside is likely to be limited near 108 – 107.360, which could confirm the bottom being in place and could start a rally to the resistance of 109.73 – 109.35 and eventually to 111.0.
GBPUSD Daily Analysis
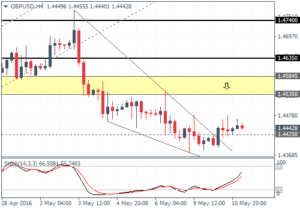
GBPUSD (1.44): GBPUSD formed an inside bar yesterday with prices closing bullish but within the Monday’s high and low range. The inside bar comes near the 1.4425 support, which marks the previous resistance level which snapped, sending GBPUSD towards April 28th higher close at 1.4673. An upside breakout here could see another rally, but it is very likely that GBPUSD will form a lower high indicative of a move to the downside unless the resistance zone of 1.4743 – 1.4635 is broken. On the 4-hour chart, a descending wedge pattern confirms this view with price moving higher above 1.4425. Initial resistance is seen at 1.4535, which could be the likely target. In the medium term, a higher low near 1.4535 – 1.4585 could see GBPUSD correct lower to 1.43 support.
Gold Daily Analysis
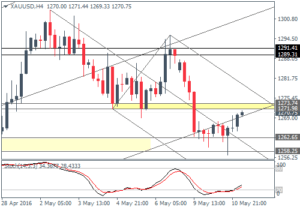
XAUUSD (1270): Gold prices formed a doji yesterday after Monday’s bearish declines. Price action is showing signs of fading momentum which could see a near term top being confirmed. As long as gold doesn’t break above $1300, we suspect that a correction to 1200 will be likely, provided gold can manage to break 1230 support. On the 4-hour chart, the falling median line is showing a correction to retest the broken support at 1273 – 1271. Establishing resistance here could confirm a move lower, but there is a risk of a break higher. In this case, gold could consolidate between 1291 – 1289 resistance and 1273 – 1271 support.
