EURUSD Daily Analysis
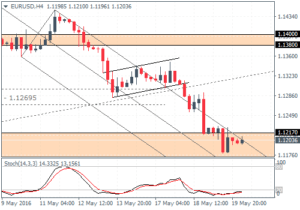
EURUSD (1.120): EURUSD’s declines were again limited yesterday, but price action fell to the lower end of the support range at 1.120. The small range formed yesterday near the support could result in a possible near term pullback off this support level with EURUSD moving back close to 1.130. On the 4-hour chart, price action’s declines confirmed with that of the bearish flag pattern. With prices trading close to the outer median line, a break above 1.12170 could see a move back to 1.130 followed by 1.1380.
USDJPY Daily Analysis
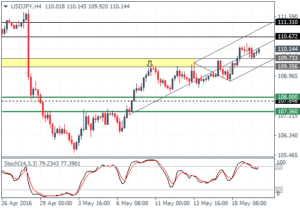
USDJPY (110.14): USDJPY has been capped by the 50 day EMA at 110 region and a pullback is likely towards 108 levels in the near term. To the upside, prices can potentially move towards 110.67 level of resistance. Support has been established at 109.733 – 109.356 and only a break below this support will see a move towards 108. The momentum in USDJPY is showing signs of easing and a near term correction to 108 – 107.5 is very likely as a result.
GBPUSD Daily Analysis
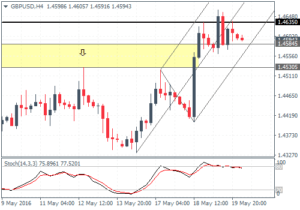
GBPUSD (1.459): GBPUSD closed with a spinning top yesterday after rallying to 1.4635. The price action marks the retest of this resistance level that was previously tested in early May. A decline off the 1.4635 – 1.4743 could see GBPUSD fall back to the lower support at 1.44250 with the next main support at 1.431 – 1.430. Only a confirmed break with a bullish candlestick above 1.4635 will clear the way for more upside in GBPUSD.
Gold Daily Analysis
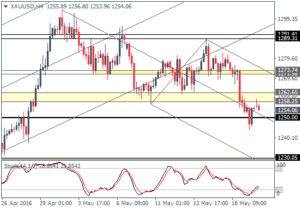
XAUUSD (1254): Gold prices fell sharply yesterday but managed to recover near the lows of 1243, which was also supported by the 50 day EMA. 1264 is now the level to watch for as any upside gains could be limited here, but at the same time, a break above 1264 could again keep gold biased to the upside. In the near term, the H4 chart shows gold will likely fall back to 1250 handle for support. As long as this support holds, gold prices could remain range bound.
