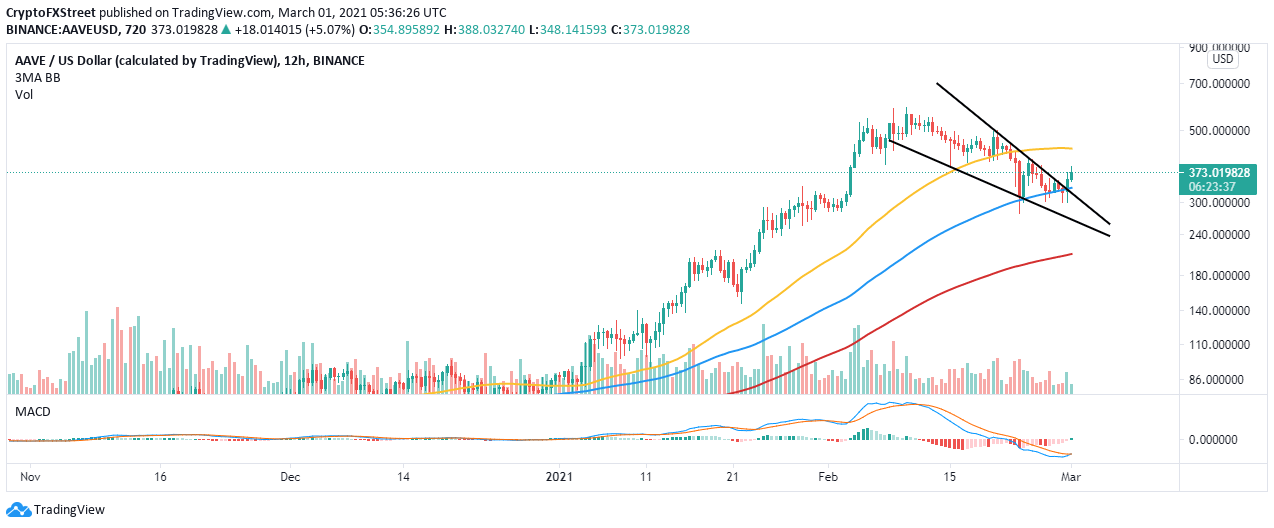
- Aave has begun the lift to higher levels following a falling wedge breakout.
- The MACD has a bullish impact, adding credibility to the bullish outlook.
- A declining network growth reveals that recovery will not be a walk in the park.
Aave is on the verge of a colossal breakout following a key technical pattern. Before the ongoing recovery, the decentralized finance (DeFi) token suffered rejection at all-time highs of $584. The breakdown from the new record high became unstoppable until support at $280 came into the picture.
Aave bullish impulse builds a key technical pattern
The rebound has been confirmed by the formation of a falling wedge pattern. AAVE also embraced support at the 100 Simple Moving Average (SMA) on the 12-hour chart, paving the way for stability and a reversal.
At the time of writing, AAVE is trading at $370 after hitting levels above the wedge. This pattern is formed amid a downtrend. One trendline is drawn to connect a series of declining peaks while the other links consecutive troughs. A period of consolidation occurs before the breakout. Note that falling wedge patterns usually have a bullish impulse.
For now, the least resistance path is upwards, especially with the Moving Average Convergence Divergence (MACD) flipping bullish. The indicator in the 12-hour timeframe shows the MACD line (blue) crossing above the signal line. This can be used as a signal to buy the bottom, primarily after Aave’s significant breakdown.
AAVE/USD 4-hour chart
Looking at the other side of the fence
Santiment, a leading behavioral analytics platform, shows that AAVE is experiencing declining network growth. The number of unique addresses topped out at roughly 3,800 on February 4. However, the drop has been consistent, with the newly-created addresses hitting 1,350 on February 28. If this metric continues to fall, Aave might continue with the drop in value, perhaps retest $280.
%20%5B09.19.37,%2001%20Mar,%202021%5D-637501763896050591.png)
Aave network growth
Similarly, higher support must be established, preferably above $370, to validate the uptrend. Otherwise, a reversal may come into the picture due to the bull’s exhaustion and increasing overhead pressure as bears swing in for revenge. On the downside, support at the 100 SMA remains key to the uptrend and must be guarded at all costs to avert potential declines to $280.
