- Aave (LEND) has been moving within a bearish trend since August 26.
- LEND/USD may extend the decline as the critical support area is broken.
Aave (LEND) topped at $0.9083 on August 26 and has been declining steadily ever since. At the time of writing, LEND/USD is changing hands at $0.6228, down over 6% on a day-to-day basis and over 31% from the top. Aave has a market value of $802 million and an average daily trading volume of $151 million, which is mostly in line with the recent values. The token is most actively traded on Binance and OKEx. Also, a decent trading volume is registered on a decentralized liquidity provision protocol Uniswap.
LEND/USD: The technical picture
LEND’s technical picture sends bearish signals. The price broke below a key support level created by a combination of 4-hour SMA100 at $0.68 and a cluster of 50EMA and 50SMA on a 12-hour chart. If the move is sustained, the sell-off may be extended towards September 2 low at $0.5533 and to the psychological $0.50.
LEND/USD 4-hour chart
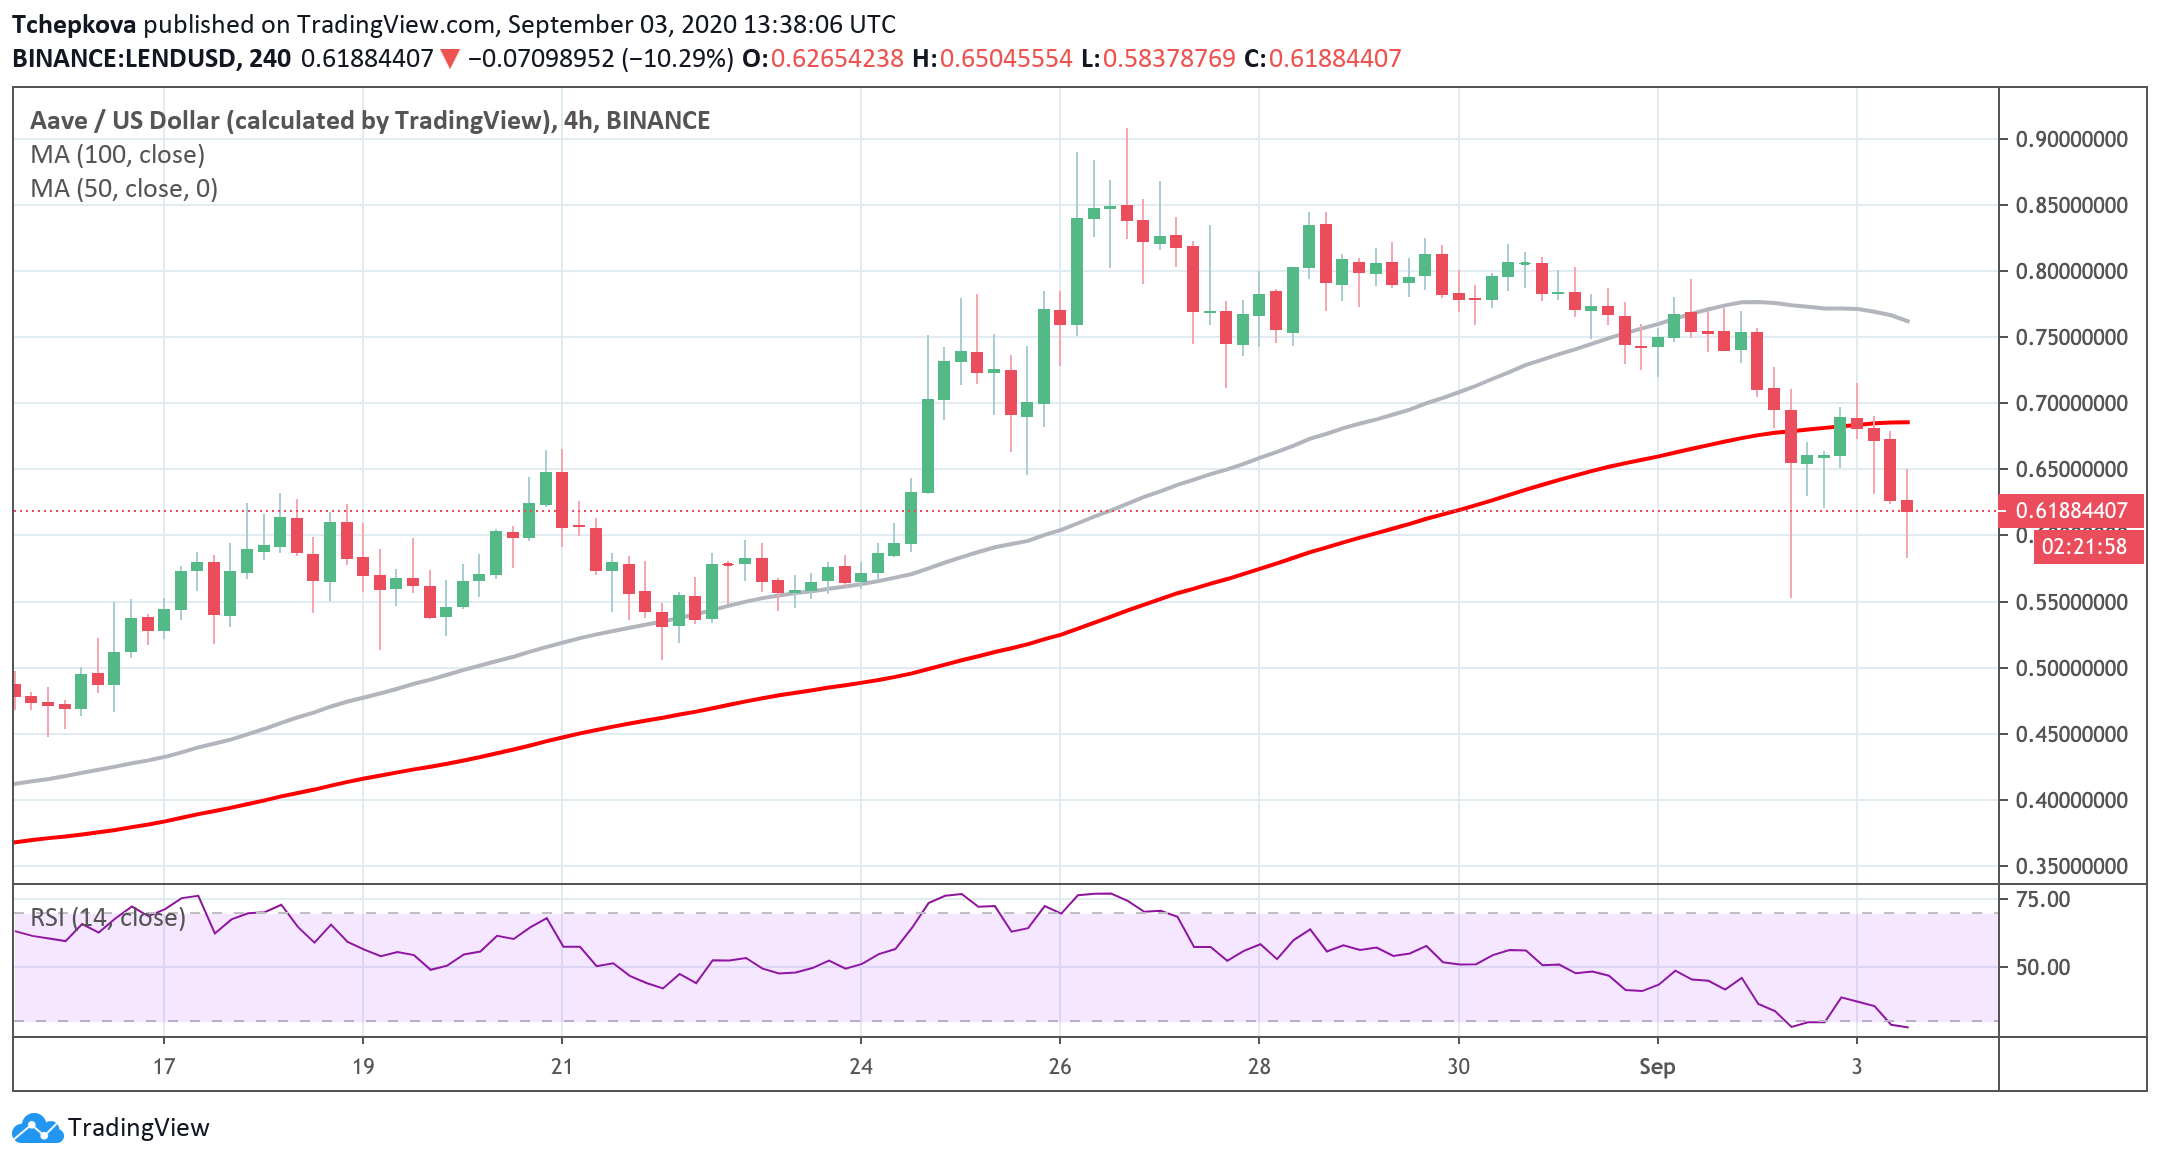
If the price manages to regain ground above the broken support area of $0.68, the recovery may gain traction and bring $0.70 back into focus. A sustainable move above this area will negate the immediate bearish scenario and allow for an extended upside move towards 4-hour SMA50 at $0.7630.
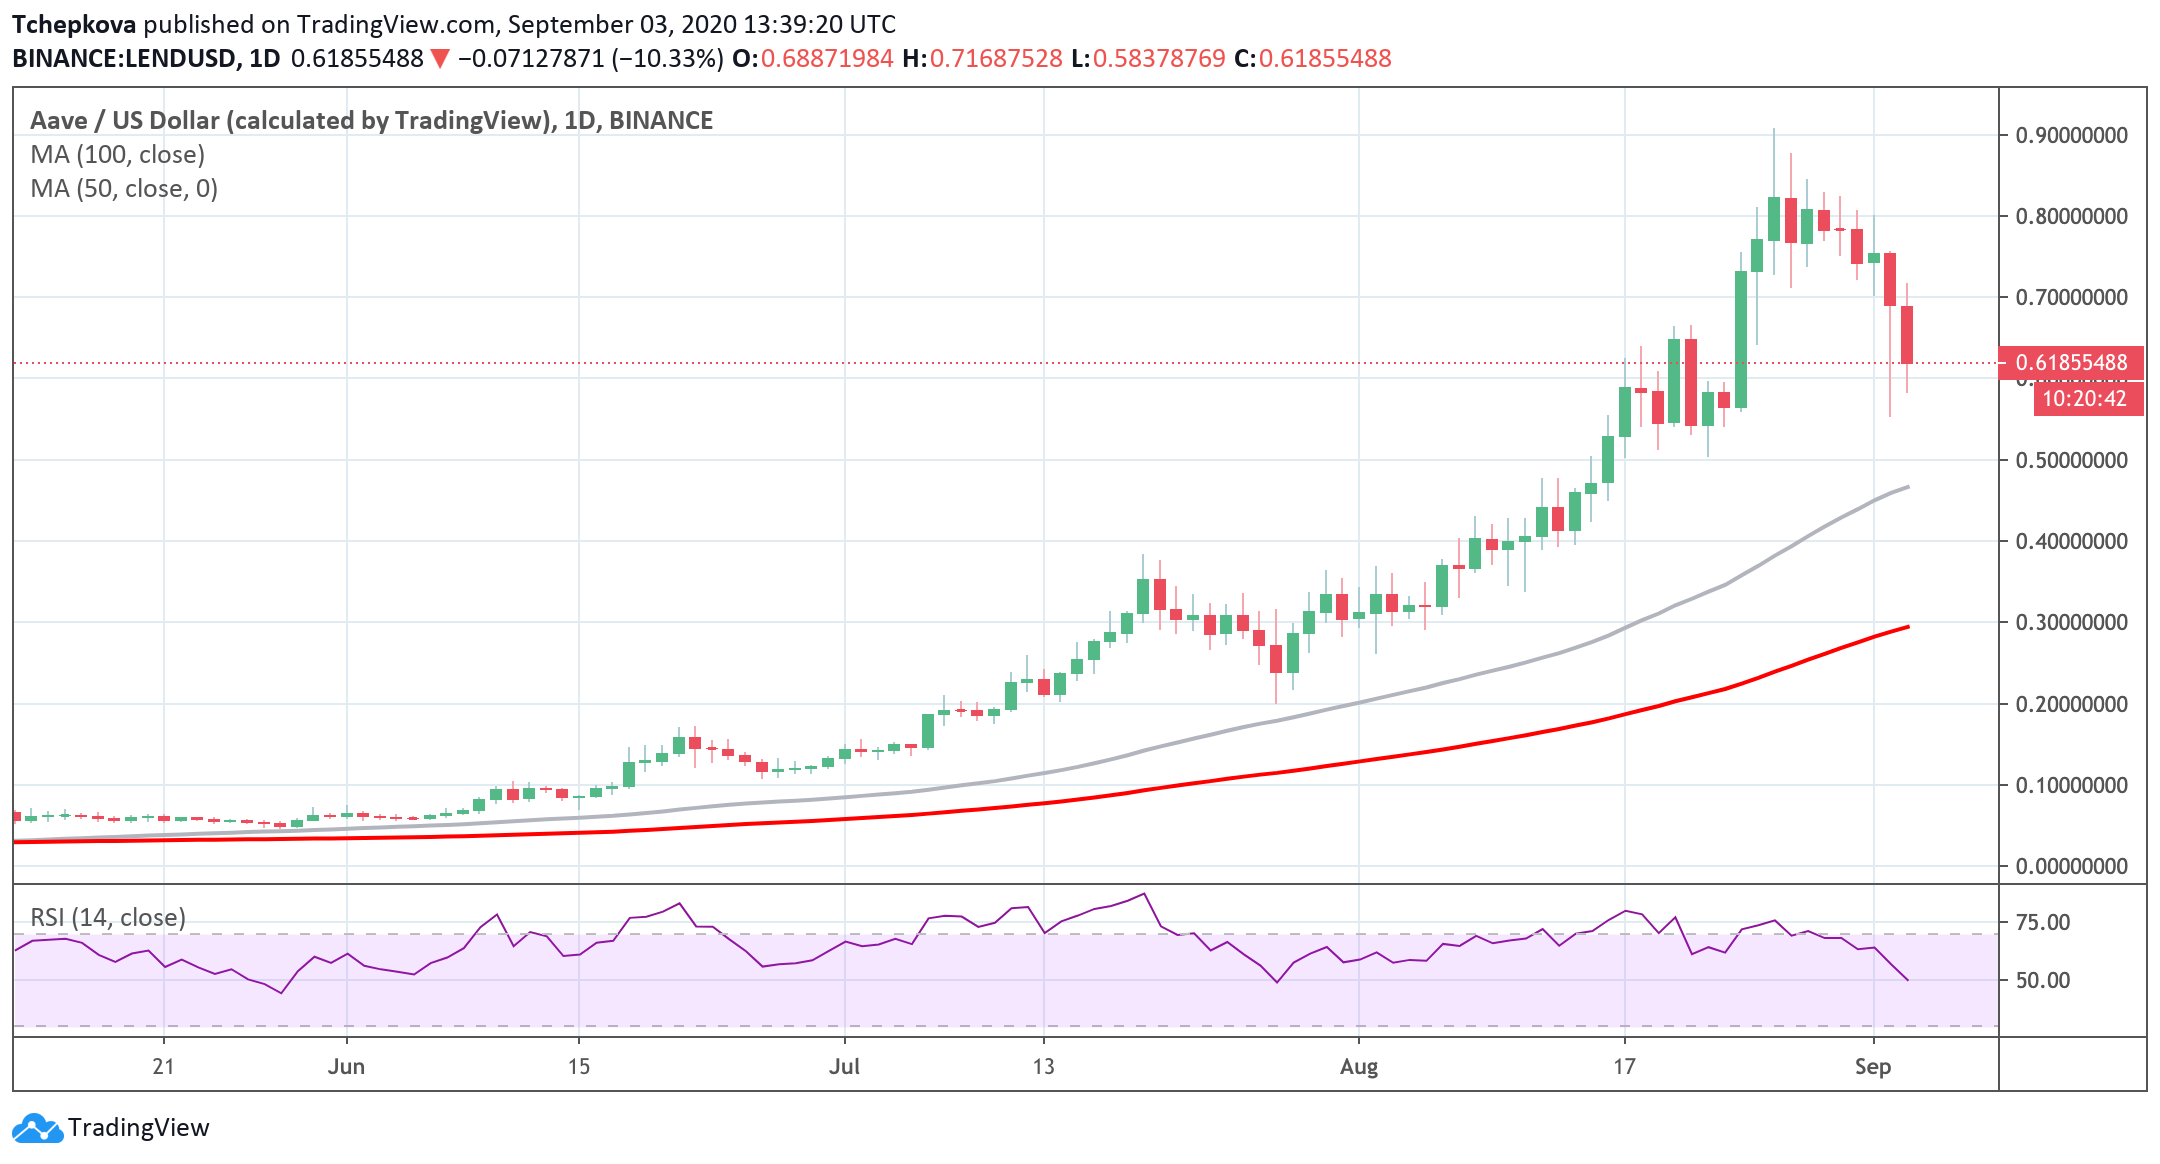
In the long-run, the critical support levels come at $0.46 (daily SMA50) and $0.30 (daily SMA100). The RSI on the daily chart points downwards with no signs of an upcoming reversal. which means the price is vulnerable to further sell-off. However, on the intraday timeframes, the coin is clearly oversold and may be ready for a rebound.
LEND/USD daily chart