- The AUD/CAD pair trades near 0.9455 during the early Asian session on Thursday.
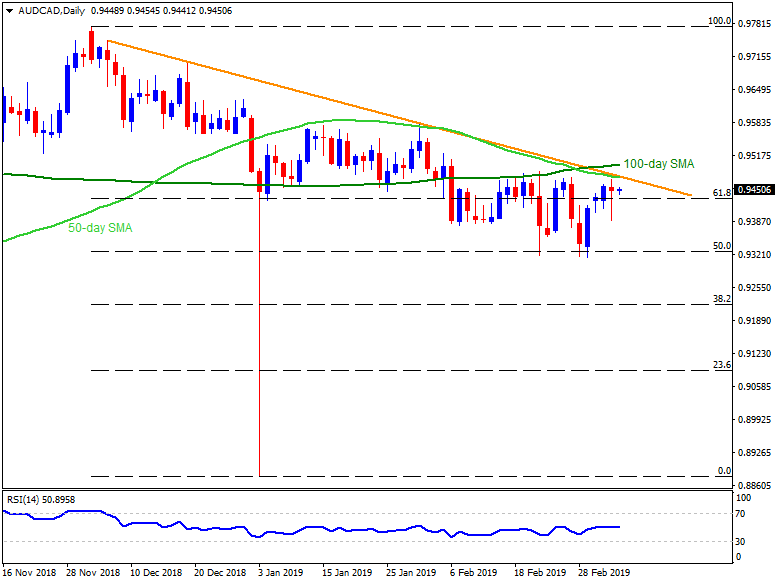
- The quote again heads to 0.9475/80 resistance confluence including 50-day simple moving average and a downward sloping trend-line stretched since December 05.
- However, Australian retail sales and trade balance data can drag the pair down if flashing weak signals.
- On the downside, 0.9380 and 0.9315 likely nearly support for the pair traders to watch.
- Should prices slide under 0.9315, 0.9270 and 0.9220 can please sellers.
- Meanwhile, an upside clearance of 0.9480 may have to surpass 100-day SMA level of 0.9505 in order to justify its strength in targeting late-January high of 0.9580.
- Additionally, the AUD/CAD pair’s successful trading above 0.9580 enables it to challenge 0.9630 and 0.9680 resistances.
AUD/CAD daily chart
Additional important levels:
Overview:
Today Last Price: 0.9452
Today Daily change: 12 pips
Today Daily change %: 0.13%
Today Daily Open: 0.944
Trends:
Daily SMA20: 0.9422
Daily SMA50: 0.9481
Daily SMA100: 0.9512
Daily SMA200: 0.9543
Levels:
Previous Daily High: 0.9474
Previous Daily Low: 0.9388
Previous Weekly High: 0.9477
Previous Weekly Low: 0.9315
Previous Monthly High: 0.9557
Previous Monthly Low: 0.9319
Daily Fibonacci 38.2%: 0.9421
Daily Fibonacci 61.8%: 0.9441
Daily Pivot Point S1: 0.9394
Daily Pivot Point S2: 0.9348
Daily Pivot Point S3: 0.9308
Daily Pivot Point R1: 0.948
Daily Pivot Point R2: 0.952
Daily Pivot Point R3: 0.9566
