AUD/CHF daily chart
- AUD/CHF trades near 0.7070 during early Thursday.
- The quote dropped to 0.7045 after Australian data flashed mixed signals but couldn’t break 0.7050-45 horizontal-area that has been challenging sellers since January 15.
- Should the pair declines beneath 0.7045, it can take 0.7000 as an intermediate halt ahead of visiting 0.6980 rest-point.
- During the pair’s additional downside under 0.6980, 0.6940 may act as a buffer prior to highlighting the 0.6880-70 support-zone.
- On the upside, 50% Fibonacci retracement of its May 2018 to January 2019 drop, at 0.7125 could restrict immediate advances whereas 0.7155 and 200-day simple moving average (SMA) of 0.7185 might entertain Bulls then after.
- Though, a descending trend-line joining December 2018 high to a previous month high, at 0.7205, may limit the pair’s rise.

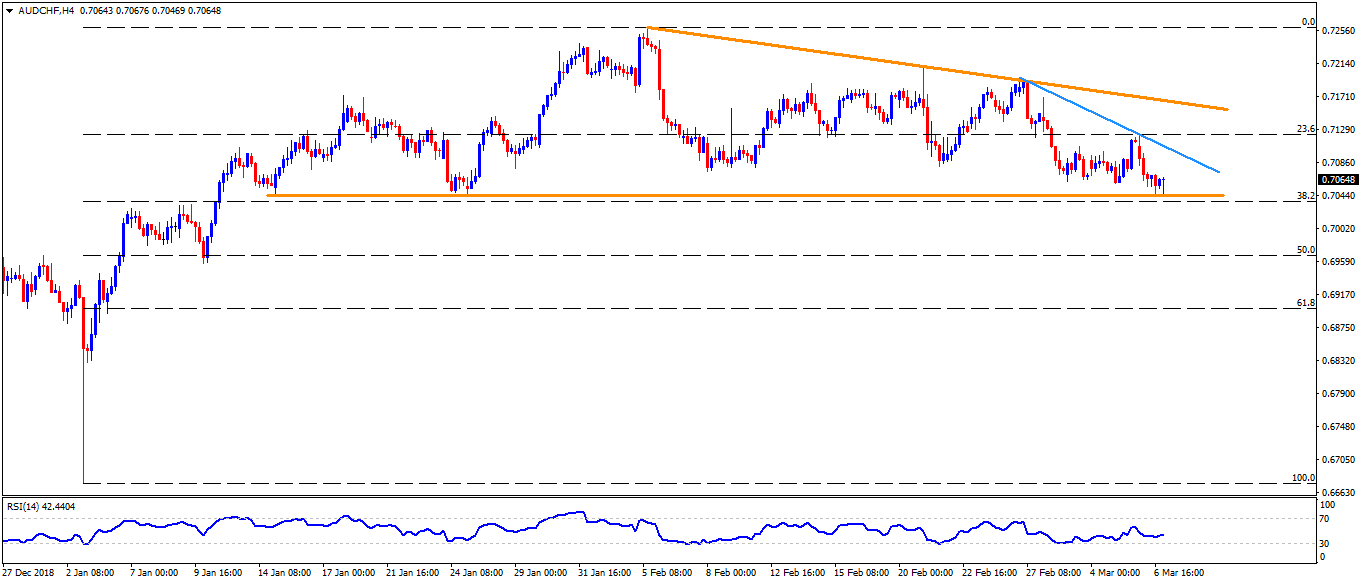
AUD/CHF 4-Hour chart
- A downward sloping resistance-line connecting highs of February 27 to March 06, at 0.7110, seem adjacent resistance for the pair.
- Also, 0.6960 can provide a stop to the decline between 0.6980 and 0.6940.
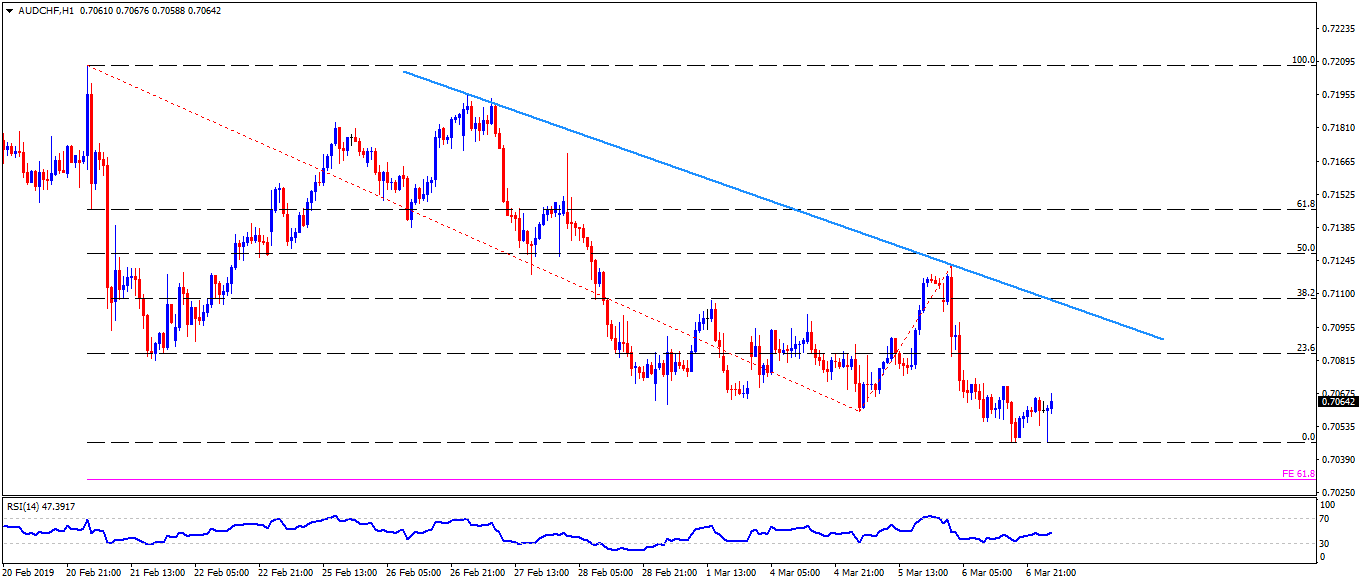
AUD/CHF hourly chart
- 0.7075 is likely to close resistance before 0.7110 trend-line barrier.
- 61.8% Fibonacci retracement of its February 21 to March 06 moves near 0.7030 can question bears’ strength under 0.7040.