- AUD/JPY stays positive above 200-day SMA.
- Bullish MACD favors further upside, 61.8% Fibonacci retracement on the buyers’ radar.
- Sellers will wait for the downside break of 38.2% Fibonacci retracement.
AUD/JPY registers 0.10% gains as trading near 74.33 during the Asian session on Thursday. In doing so, the pair justifies the sustained trading above 200-day SMA and bullish MACD. However, a confluence of 100-day SMA and 50% Fibonacci retracement of December 2019 to January 2020 declines seem a tough nut to crack for the buyers.
It should also be noted that Australian employment data for January will also be the key to watch for the near-term direction.
In a case data provide a positive surprise and propels the AUD/JPY pair beyond 74.45/50 immediate resistance confluence, 74.85 can be the next levels to watch ahead of 61.8% Fibonacci retracement around 75.00.
If at all the bulls manage to dominate past-75.00, January 23 high near 75.50 will be the important upside barrier.
Meanwhile, the pair’s daily closing below 200-day SMA level of 74.25 can drag it back to 38.2% Fibonacci retracement, at 74.00 now, a break of which might not refrain to recall 73.60 and 73.60 numbers to the south.
AUD/JPY daily chart
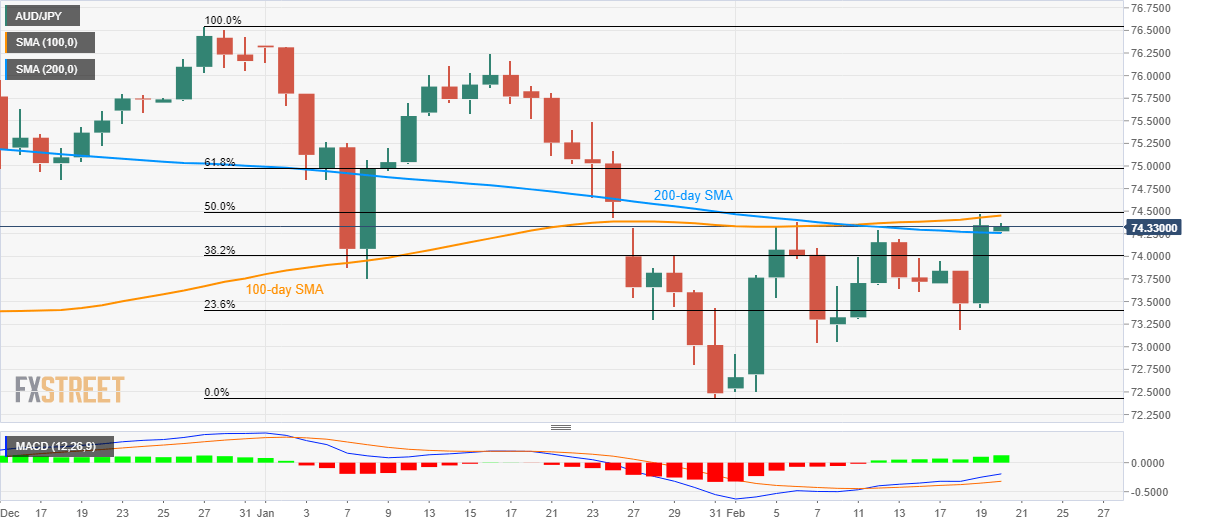
Trend: Bullish
