- AUD/JPY sellers catch a breath after ruling for five days in a row.
- Prices recently bounced off two-week low, stay below 23.6% Fibonacci retracement.
- An ascending trend line from October offers strong support.
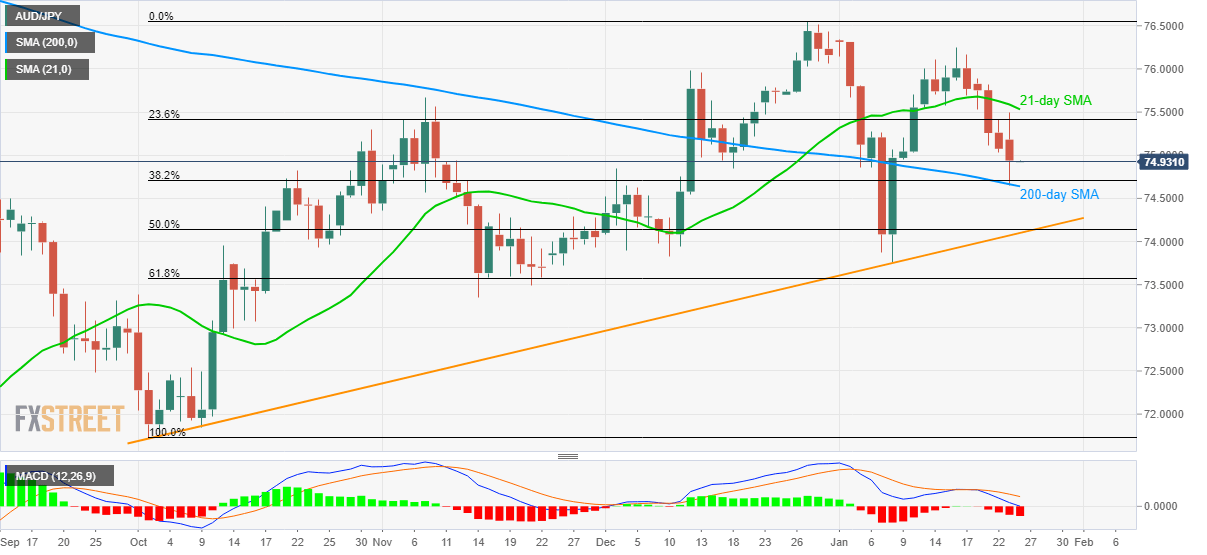
AUD/JPY trades modestly changed to 74.93 at the start of Friday’s Asian session. The pair recently dropped to the lowest in two-weeks but 200-day SMA and 38.2% Fibonacci retracement of its October-December 2019 rise confined further declines.
With this, the quote may witness some pullback towards 75.00 and 23.6% Fibonacci retracement level near 75.40. However, a 21-day SMA level of 75.55 can cap the recovery afterward.
If AUD/JPY prices rally beyond 75.55, the monthly top near 76.30 will be on the bulls’ radar.
Meanwhile, a downside break of 74.70/60 support confluence, comprising 200-day SMA and 38.2% Fibonacci retracement, can drag the pair to a multi-month-old rising support line and 50% Fibonacci retracement, around 74.15/10 now.
In a case where the bears dominate below 74.10, odds of the pair’s revisit to the monthly low near 73.75 can’t be ruled out.
AUD/JPY daily chart
Trend: Pullback expected
