- AUD/JPY consolidates recent losses after declining to two-week low the previous day.
- Bearish MACD, sustained support line break favor sellers.
- Seven-day-old falling trend line adds to the upside filters.
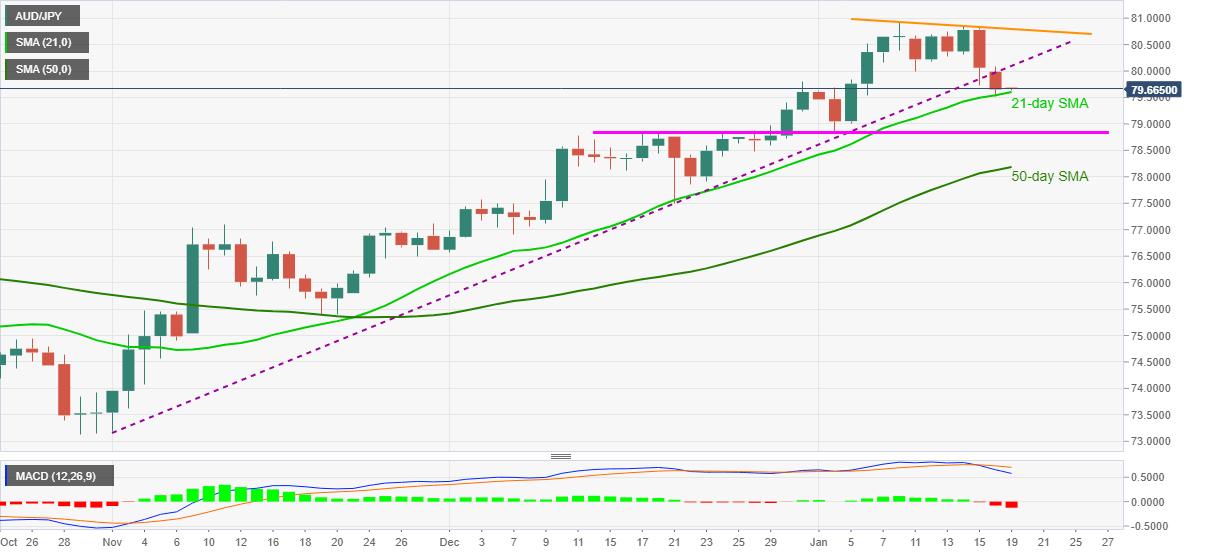
AUD/JPY sellers attack the lower end of the short-term trading range above 79.50, currently down around 79.63, during the early Asian session on Tuesday. The quote dropped to the lowest since January 05 after breaking an upward sloping trend line from November 02 on Monday. However, 21-day SMA stopped the quote’s further declines amid a dull session.
Even so, the strongest bearish MACD in over two months join a successful downside break of the key support line, now resistance, keeps the AUD/JPY sellers hopeful.
However, a clear break below the 21-day SMA level of 79.60 becomes necessary for the bears to eye 78.85/80 support zone comprising the mid-December highs and early January lows.
Following that, AUD/JPY south-run may have to conquer the 50-day SMA level of 78.18 before revisiting the early December levels surrounding 77.50.
Meanwhile, corrective pullback beyond the previous support line, at 80.10 now, may fall short of convincing the AUD/JPY buyers as a descending trend line from January 08, currently around 80.80, will precede the monthly peak near 81.00 to challenge the further upside.
AUD/JPY daily chart
Trend: Bearish
